

Hi, it’s Colin! Welcome to the 119 new subscribers who have joined Take Rate since the last post. I am excited to have you join the 5,269+ marketplace founders, operators, and investors who subscribe. Join the fun! 👇
“Haven’t all the marketplace ideas already been done?”
I hear this weekly from skeptical VC counterparts and LPs, and I can understand where they are coming from. The era of “underutilized fixed asset” marketplaces seems to be sunsetting. The big names of that era, like Airbnb, are still trading below their IPO prices, and Brian Chesky has started a new AI lab. The category feels tired.
On top of that sentiment, the fundraising headlines tell the story that AI is in, and everything else is out. The actual VC funding certainly supports it, with capital largely flowing into a few select startups, such as Anthropic and OpenAI.
But despite the bleak picture, the reality is much brighter than you might expect. There are new surface areas in marketplaces that are scaling rapidly.
Data marketplaces such as Mercor, Handshake AI, Micro1, Scale AI, and Turing are ripping. Mercor just announced $2B in “ARR”.


Prediction marketplaces like Kalshi and Polymarket are growing rapidly and are widely adopted. Even Meta is entering the fray with its own prediction market competitor.
Token marketplaces are scaling too. OpenRouter brings model providers and developers together on one side and the other, making each side more valuable as the other grows.
UGC marketplaces like SideShift (Yonder portco) are becoming distribution infrastructure for brands, connecting them with large creator networks that produce high-volume, authentic content without traditional influencer followings. As content creation gets cheaper, distribution becomes the scarce resource.
Similar opportunities are emerging in areas that did not look like obvious marketplace categories five years ago:
Space: launch capacity, satellite data, ground infrastructure, and in-orbit services.
Hardware and robotics: equipment utilization, autonomous fleets, robot labor, maintenance, and shared capacity.
Pharma and healthcare: clinical-trial recruitment, specialty care, diagnostics, lab capacity, and health data.
Energy and grid infrastructure: distributed generation, storage, grid capacity, materials, and project development.
Industrial and defense procurement: specialized manufacturing capacity, components, logistics, and compliance-heavy supply chains.
Regulated professional services: legal, insurance, accounting, and compliance workflows where software handles intake and routes work to experts.
These businesses may look different on the surface, but they still share the same underlying pattern: AI makes marketplaces dramatically more efficient to operate, while proprietary supply, data, and workflows make the networks harder to copy. That is why I think marketplaces are quietly becoming the next app-level category to take off in the AI age.
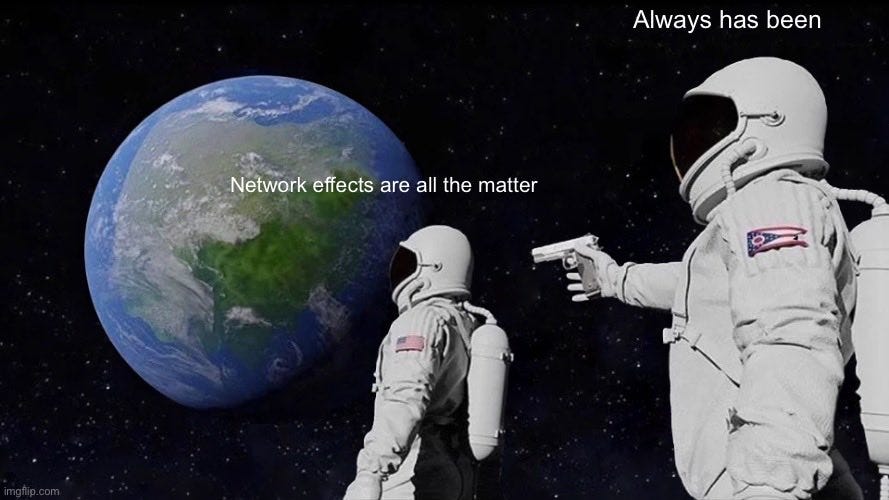
Mike Mignano made a related point recently: “Network effects are the answer. Like they’ve always been.” He argues that AI can copy a database or commoditize a model, but it cannot copy the people actively participating in a network. That is exactly why marketplaces will matter more, not less, in an AI-dominated world. And we are not the only ones feeling this way…

VCs have largely moved on from marketplaces, which is a big part of why I started Yonder. But the category is not dead. AI is expanding what a marketplace can be. The generic “connect buyers and sellers, take a fee” pitch is harder to fund than it was in 2021. The companies breaking through are more technical, more data-rich, more vertical, and sometimes more financialized. That creates a strange fundraising market: a generic marketplace can feel almost unfundable, while an AI-native or category-defining one can still raise as if it is at the center of the next wave.
The obvious question is whether the fundraising data supports what we are feeling on the ground. The short answer is yes, but with an important caveat: the category is producing real breakouts while the middle and bottom of the market are getting squeezed harder than ever.
To help shed some light on this, Carta’s Hamza Shad and Peter Walker shared a custom analysis of marketplace fundraising from Pre-Seed through Series B. I am very thankful to them as they have shared this data throughout the years (2023 and 2025 here). I also pulled in benchmarks from SVB and Yonder to help founders understand what it actually takes to raise in this environment. The picture that emerges is a market with fewer winners, a brutal Seed-to-Series A gap, and real rewards for the companies that make it through.
Let’s dig in.
If you haven’t subscribed to Carta’s Data Insights, please do so!
Marketplace Fundraising by the Numbers
Data Note: This is just data from Carta and does not represent ALL the funding rounds in the market, including many of the Yonder portfolio companies, but it is directionally accurate.
This is the first year I’ve included Pre-Seed data in this analysis. The earliest stage is still alive but contracting significantly for marketplaces.
Pre-Seed Marketplace Fundraising Volume
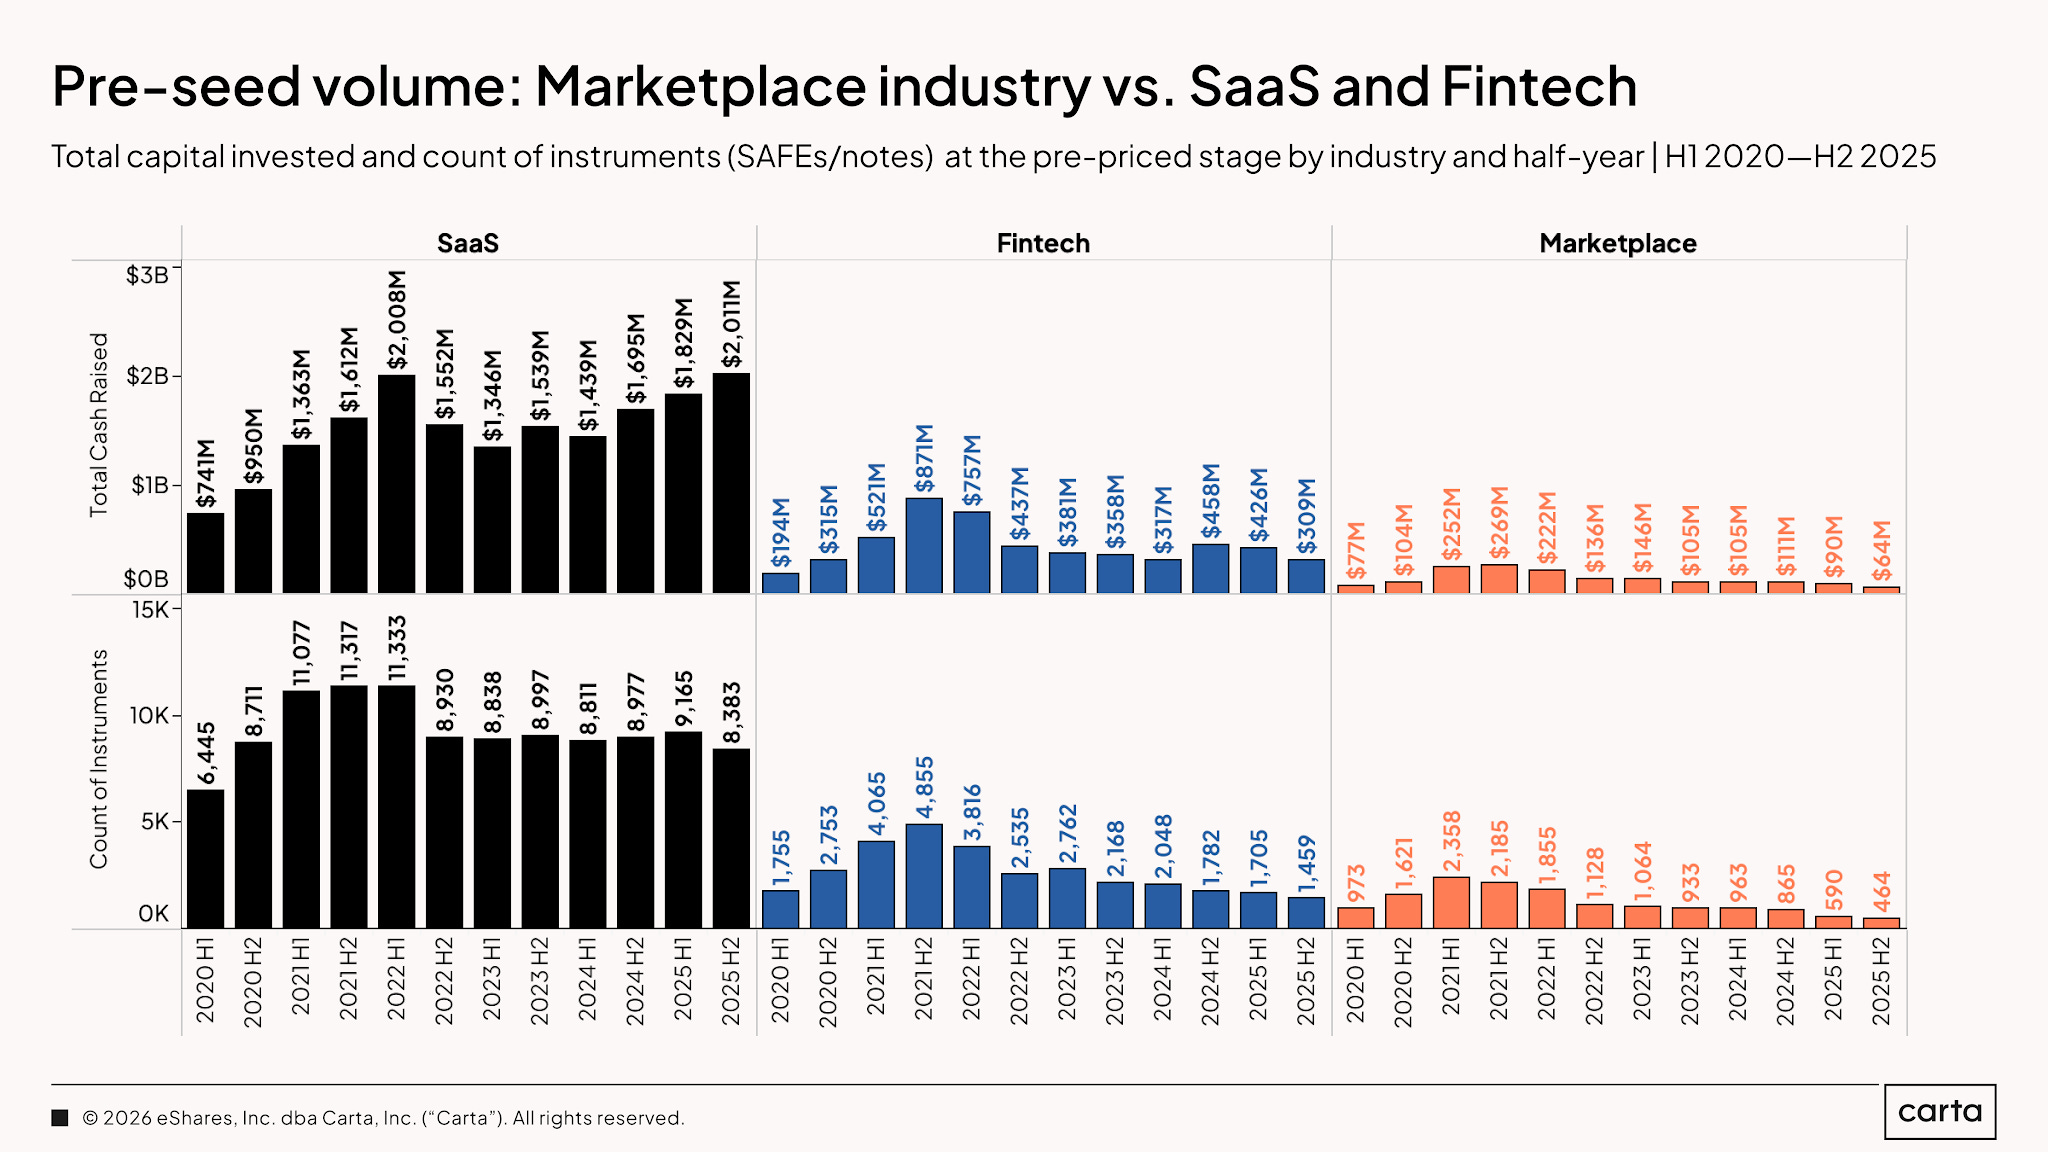
Marketplace Pre-Seed instrument count fell from a peak of 2,358 in H1 2021 to 464 in H2 2025 (-80%), while total capital invested fell from $269M to $64M (-76%). The market remains active, but capital is reaching far fewer marketplace companies than it did at the peak. For comparison, from H1 2020 to H2 2025, SaaS Pre-Seed instrument count rose from 6,445 to 8,383 (+30%) and capital invested rose from $741M to $2B (+171%), while Fintech instrument count fell from 1,755 to 1,459 (-17%) even as capital invested rose from $194M to $309M (+59%).
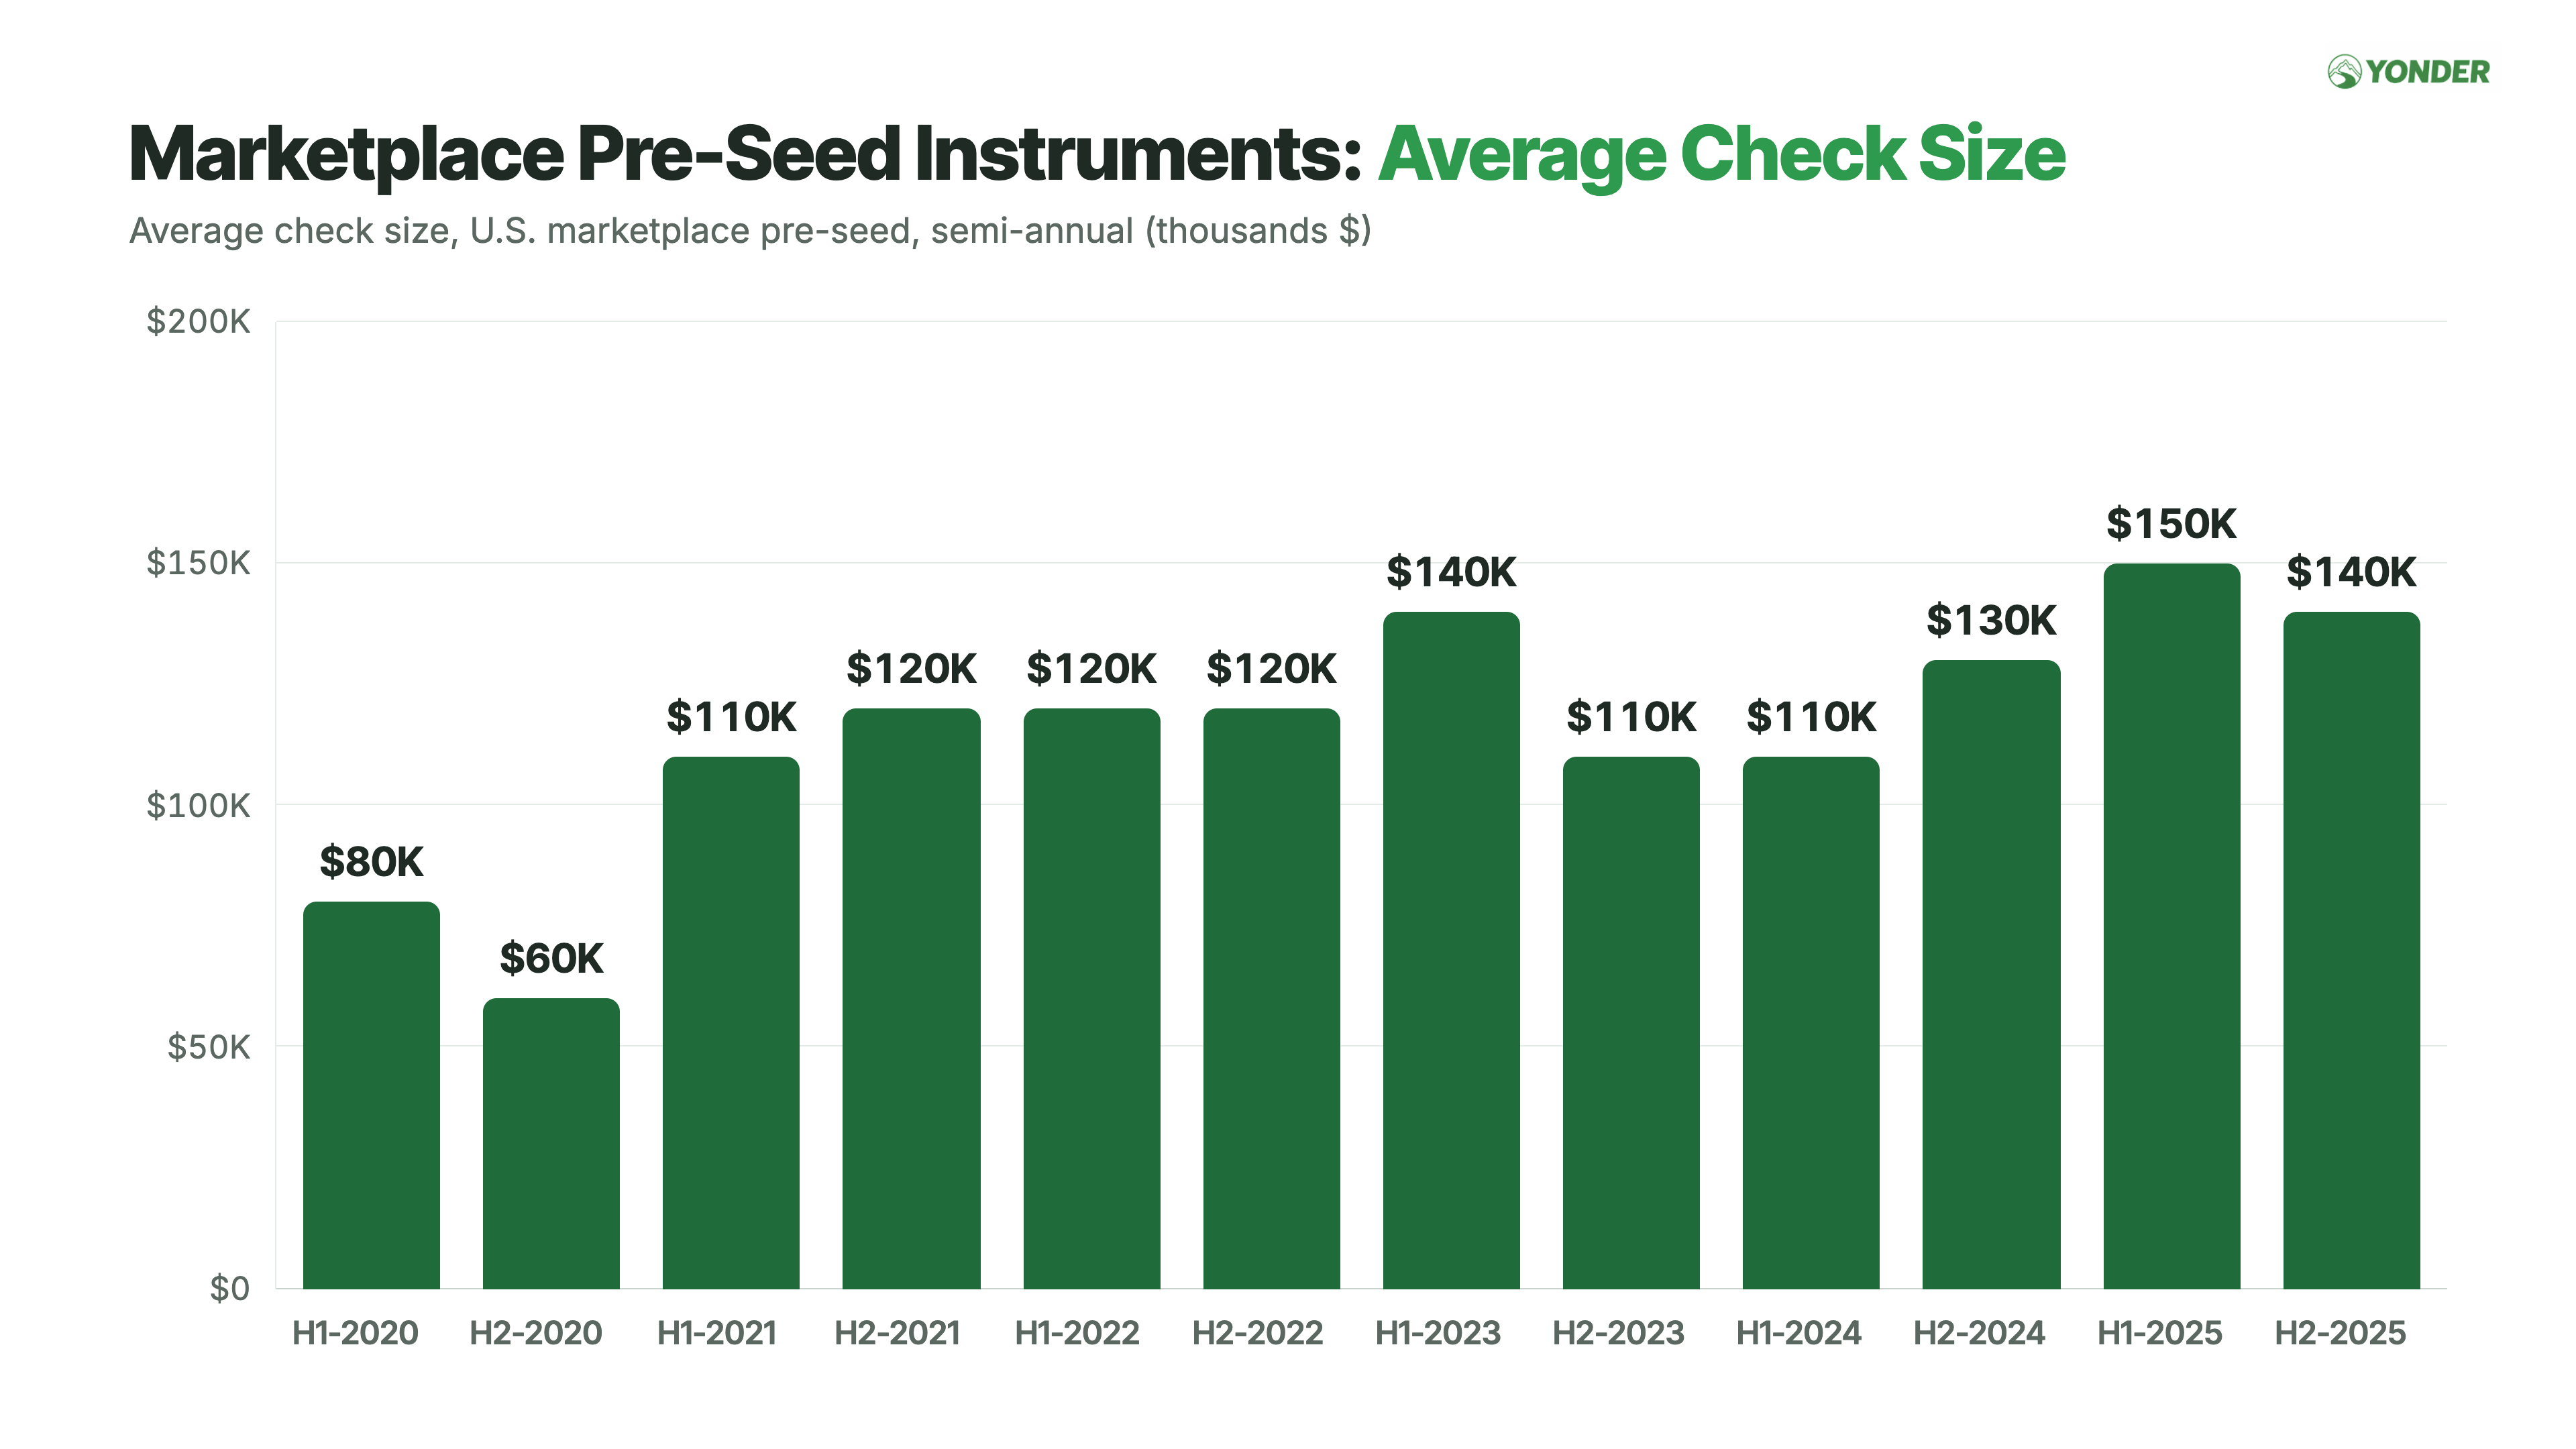
Average capital per Pre-Seed instrument has moved up even as activity has fallen, rising from $80K in H1 2020 to $140K in H2 2025 (+75%). This metric is a little wonky, though: Carta tracks instruments rather than complete rounds, and a single Pre-Seed round can include multiple SAFEs or notes. Treat it as a directional measure of check size, not the average size of a full Pre-Seed round.
Pre-Seed Marketplace Fundraising Valuations
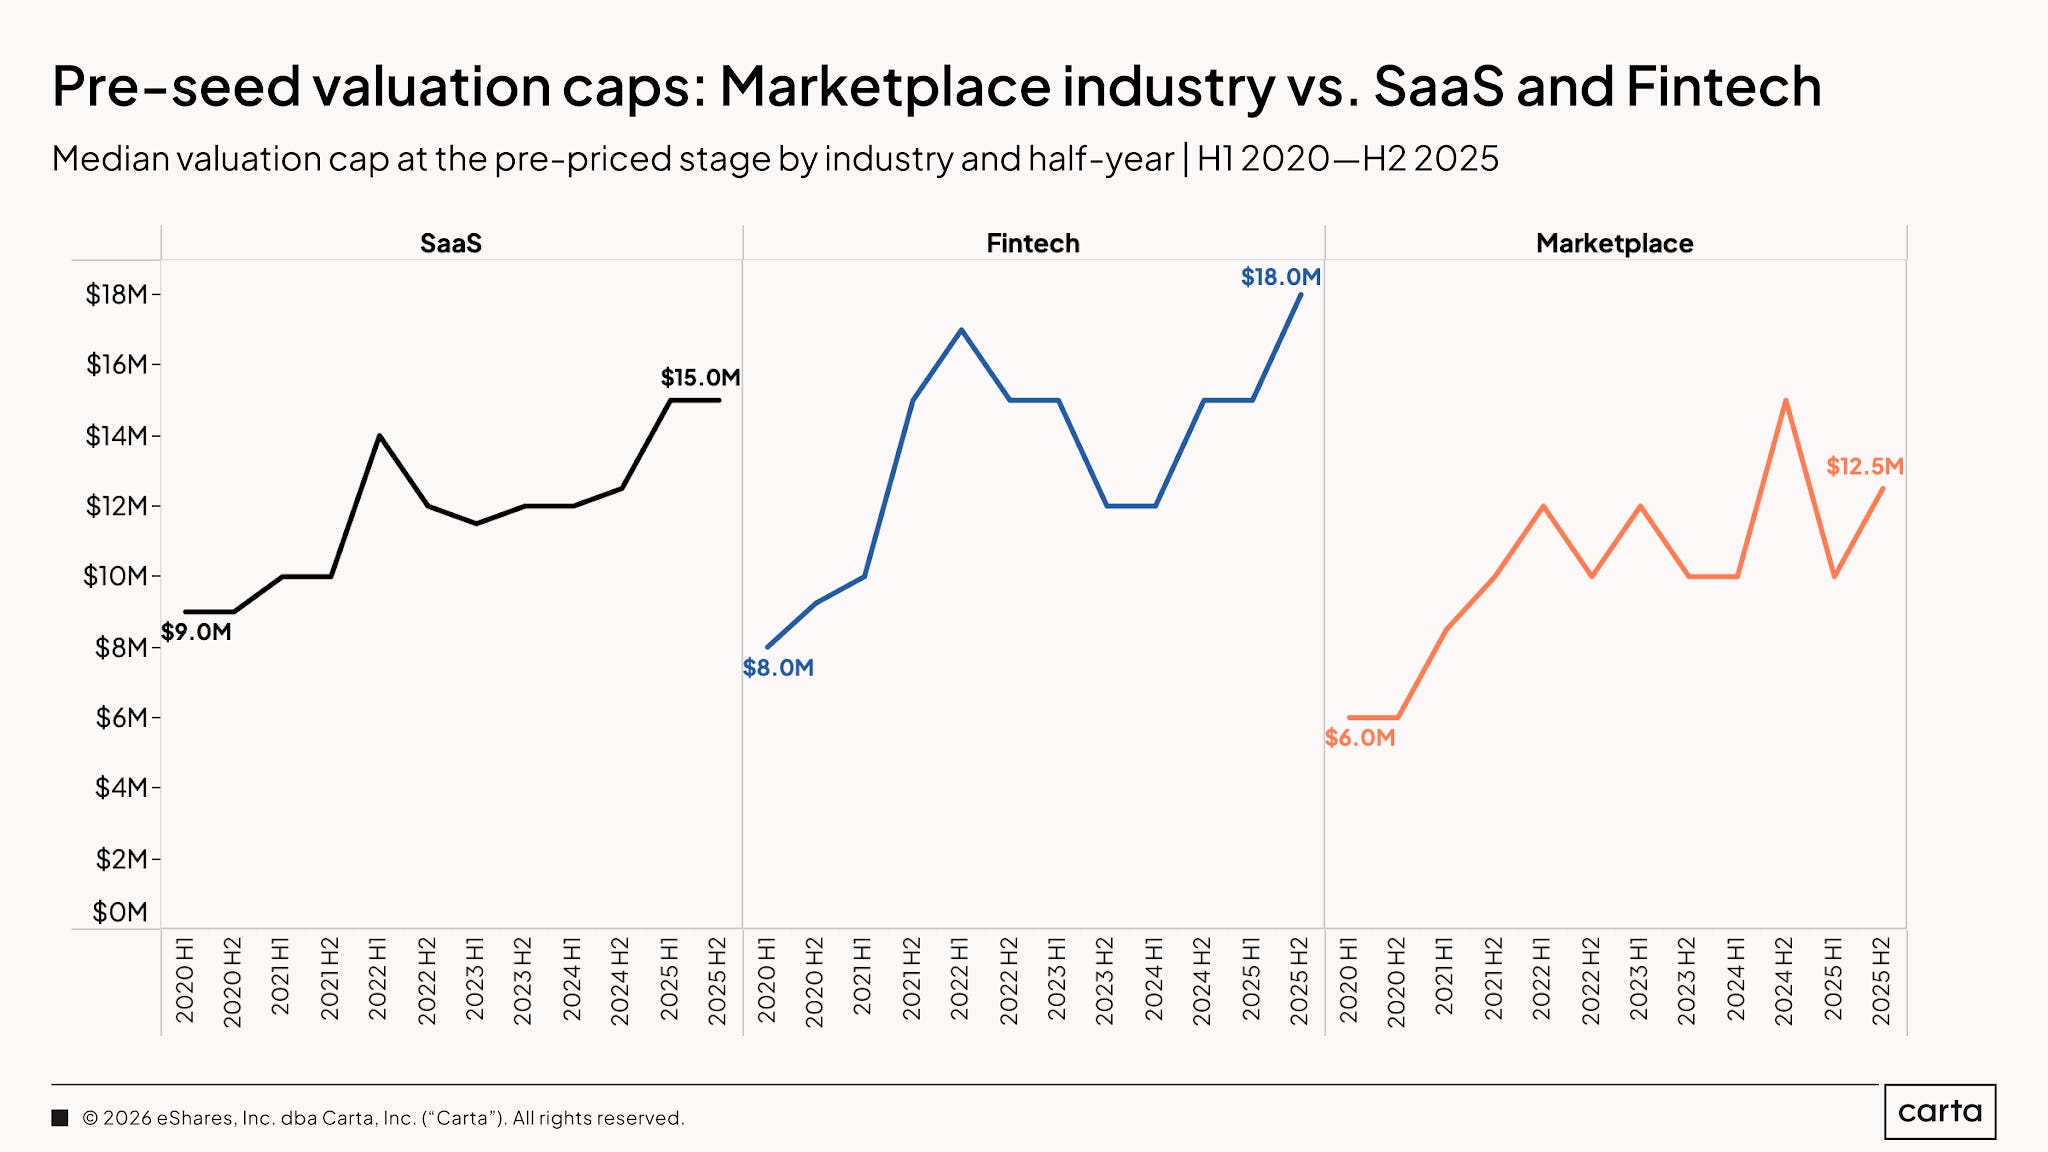
Median marketplace Pre-Seed caps have more than doubled since the beginning of the chart, rising from $6M in H1 2020 to $12.5M in H2 2025 (+108%). That is also above the roughly $10M trough from late 2021 through 2023. For comparison, SaaS increased from $9M to $15M (+67%) over the same period, while Fintech increased from $8M to $18M (+125%).
Put the three charts together, and the story is pretty clear: instrument count is down 80% from the peak, but average investment size is up 17%, and median caps remain above their recent trough. The market is not repricing every marketplace company downward; rather, it is funding fewer of them while maintaining solid terms for the companies that make the cut.
Seed Marketplace Fundraising Volume
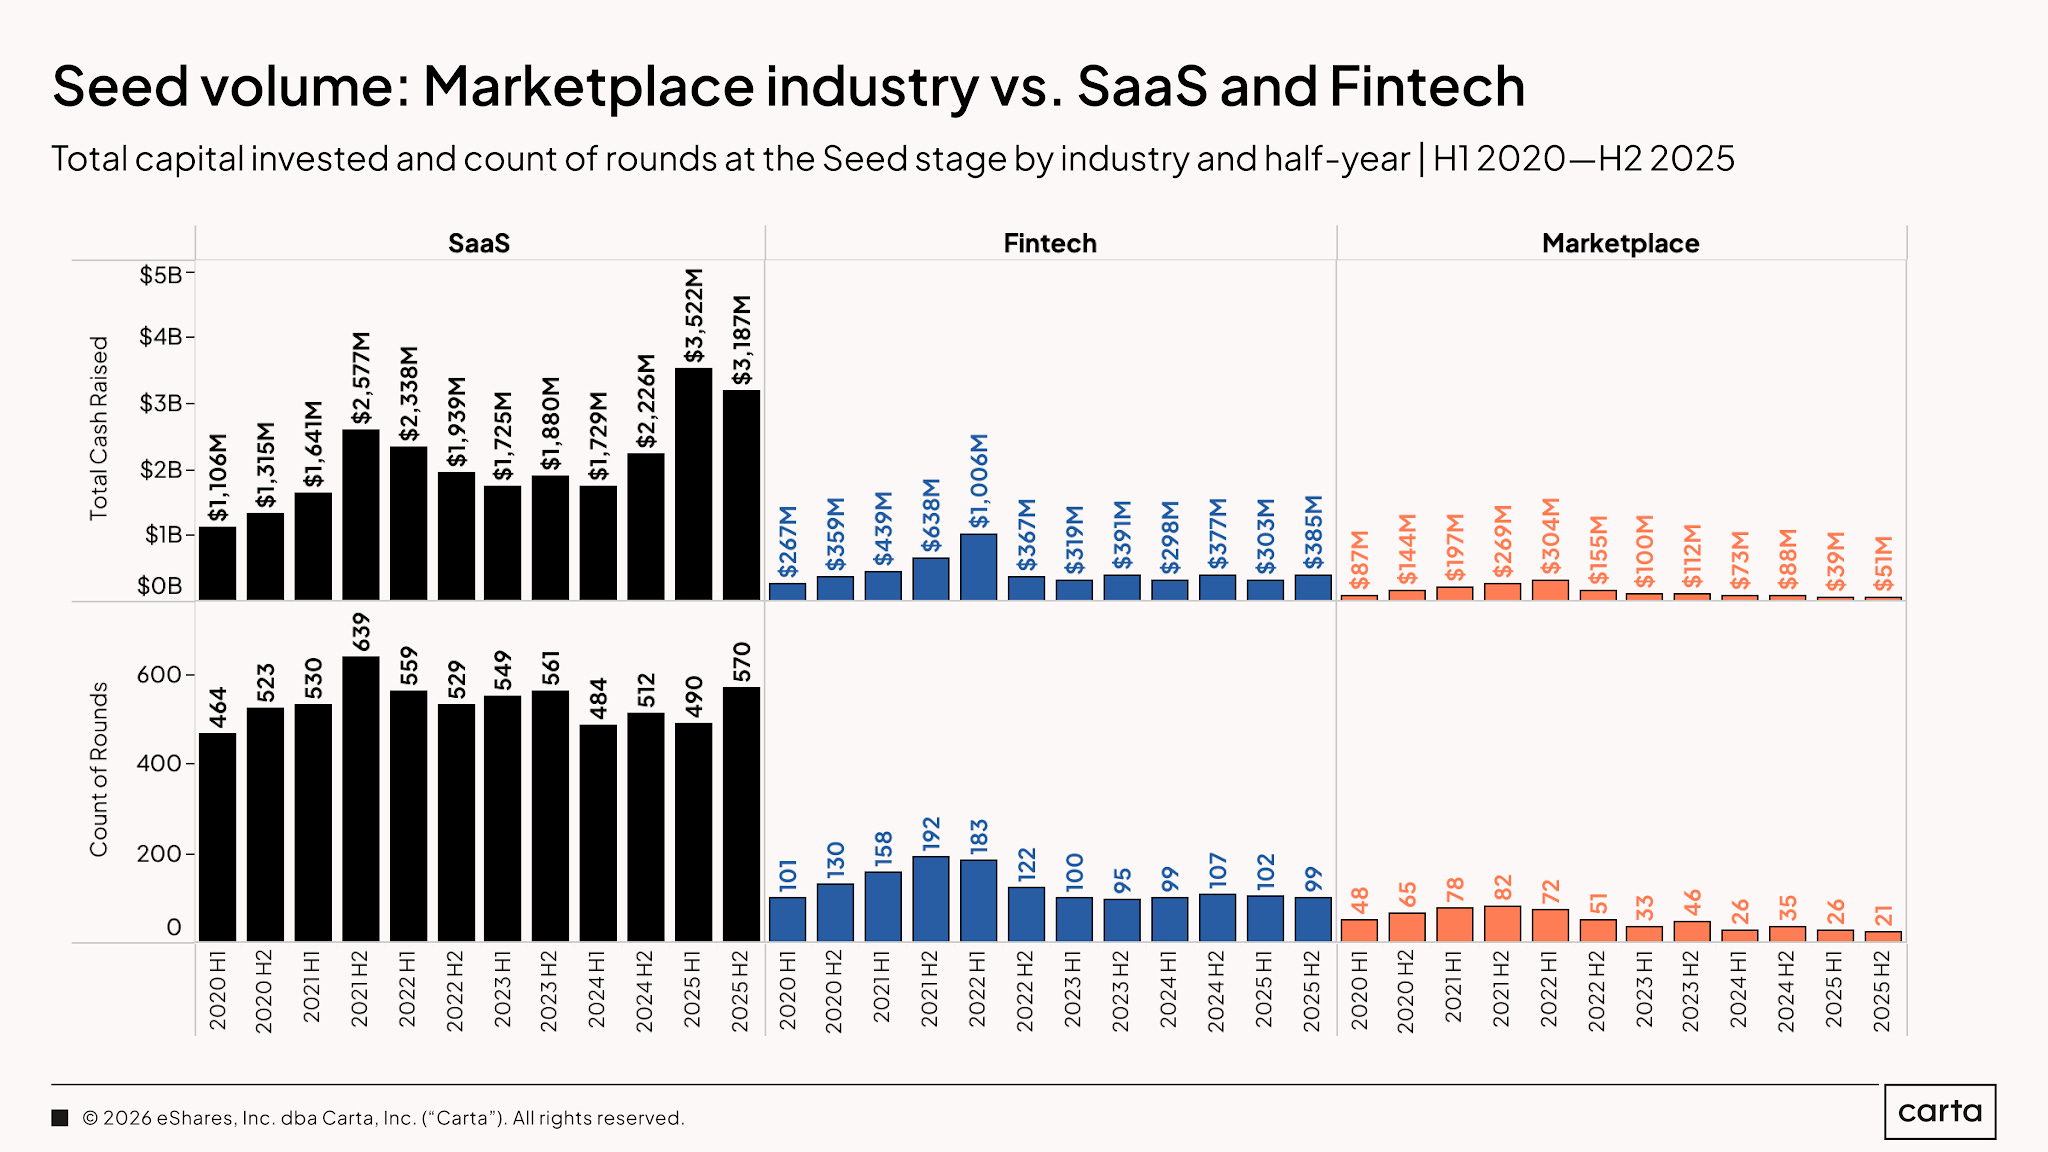
Marketplace Seed round count fell from a peak of 82 in H2 2021 to 21 in H2 2025 (-74%). Total capital invested fell from a peak of $304M in H1 2022 to $51M in H2 2025 (-83%) and is down from $87M in H1 2020 (-41%). For comparison, from H1 2020 to H2 2025, SaaS round count rose from 464 to 570 (+23%) and capital invested rose from $1.1B to $3.2B (+200%), while Fintech round count slipped from 101 to 99 (-2%) even as capital invested rose from $267M to $385M (+44%). Seed has contracted in both the number of rounds and total dollars invested, although capital recovered from $39M in H1 2025 to $51M in H2 2025 (+31%).
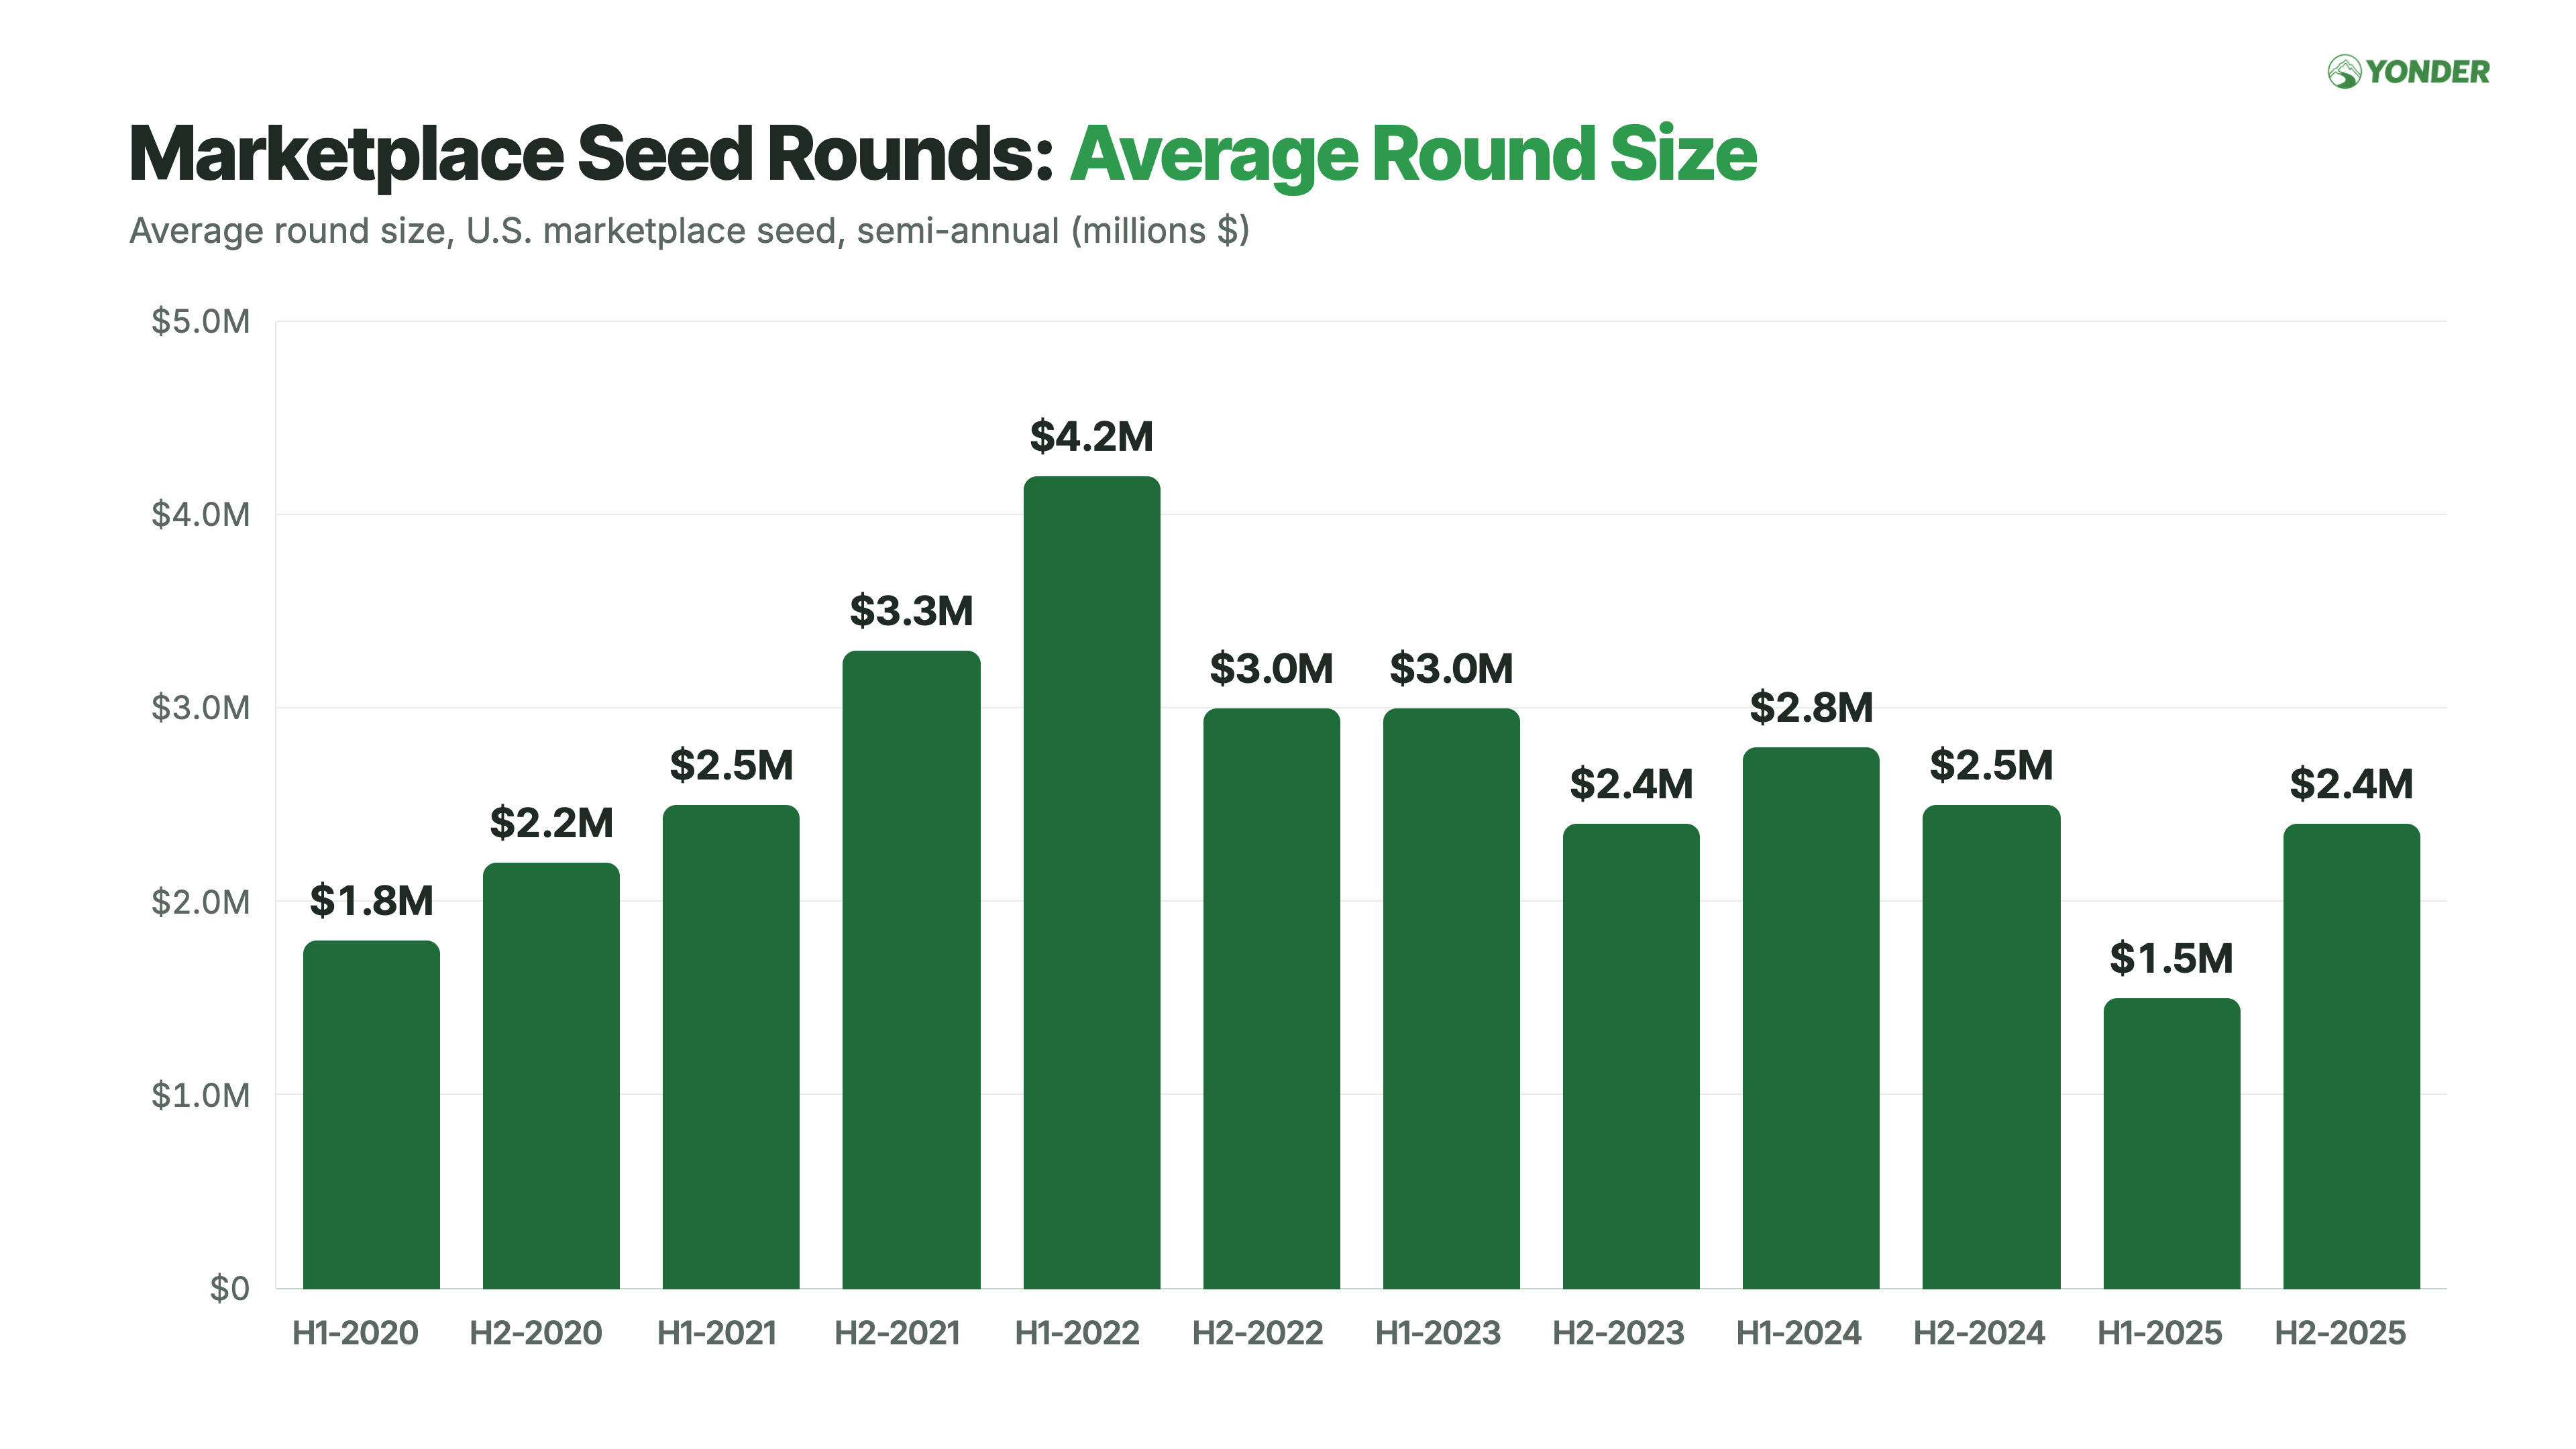
Average Seed investment size rose from $1.8M in H1 2020 to $2.4M in H2 2025 (+33%) but remains below the $4.2M peak in H1 2022 (-43%). The typical Seed round is still larger than at the beginning of the chart, but materially smaller than during the peak funding market. Can we bring back the quantitative easing?
Seed Marketplace Fundraising Valuations
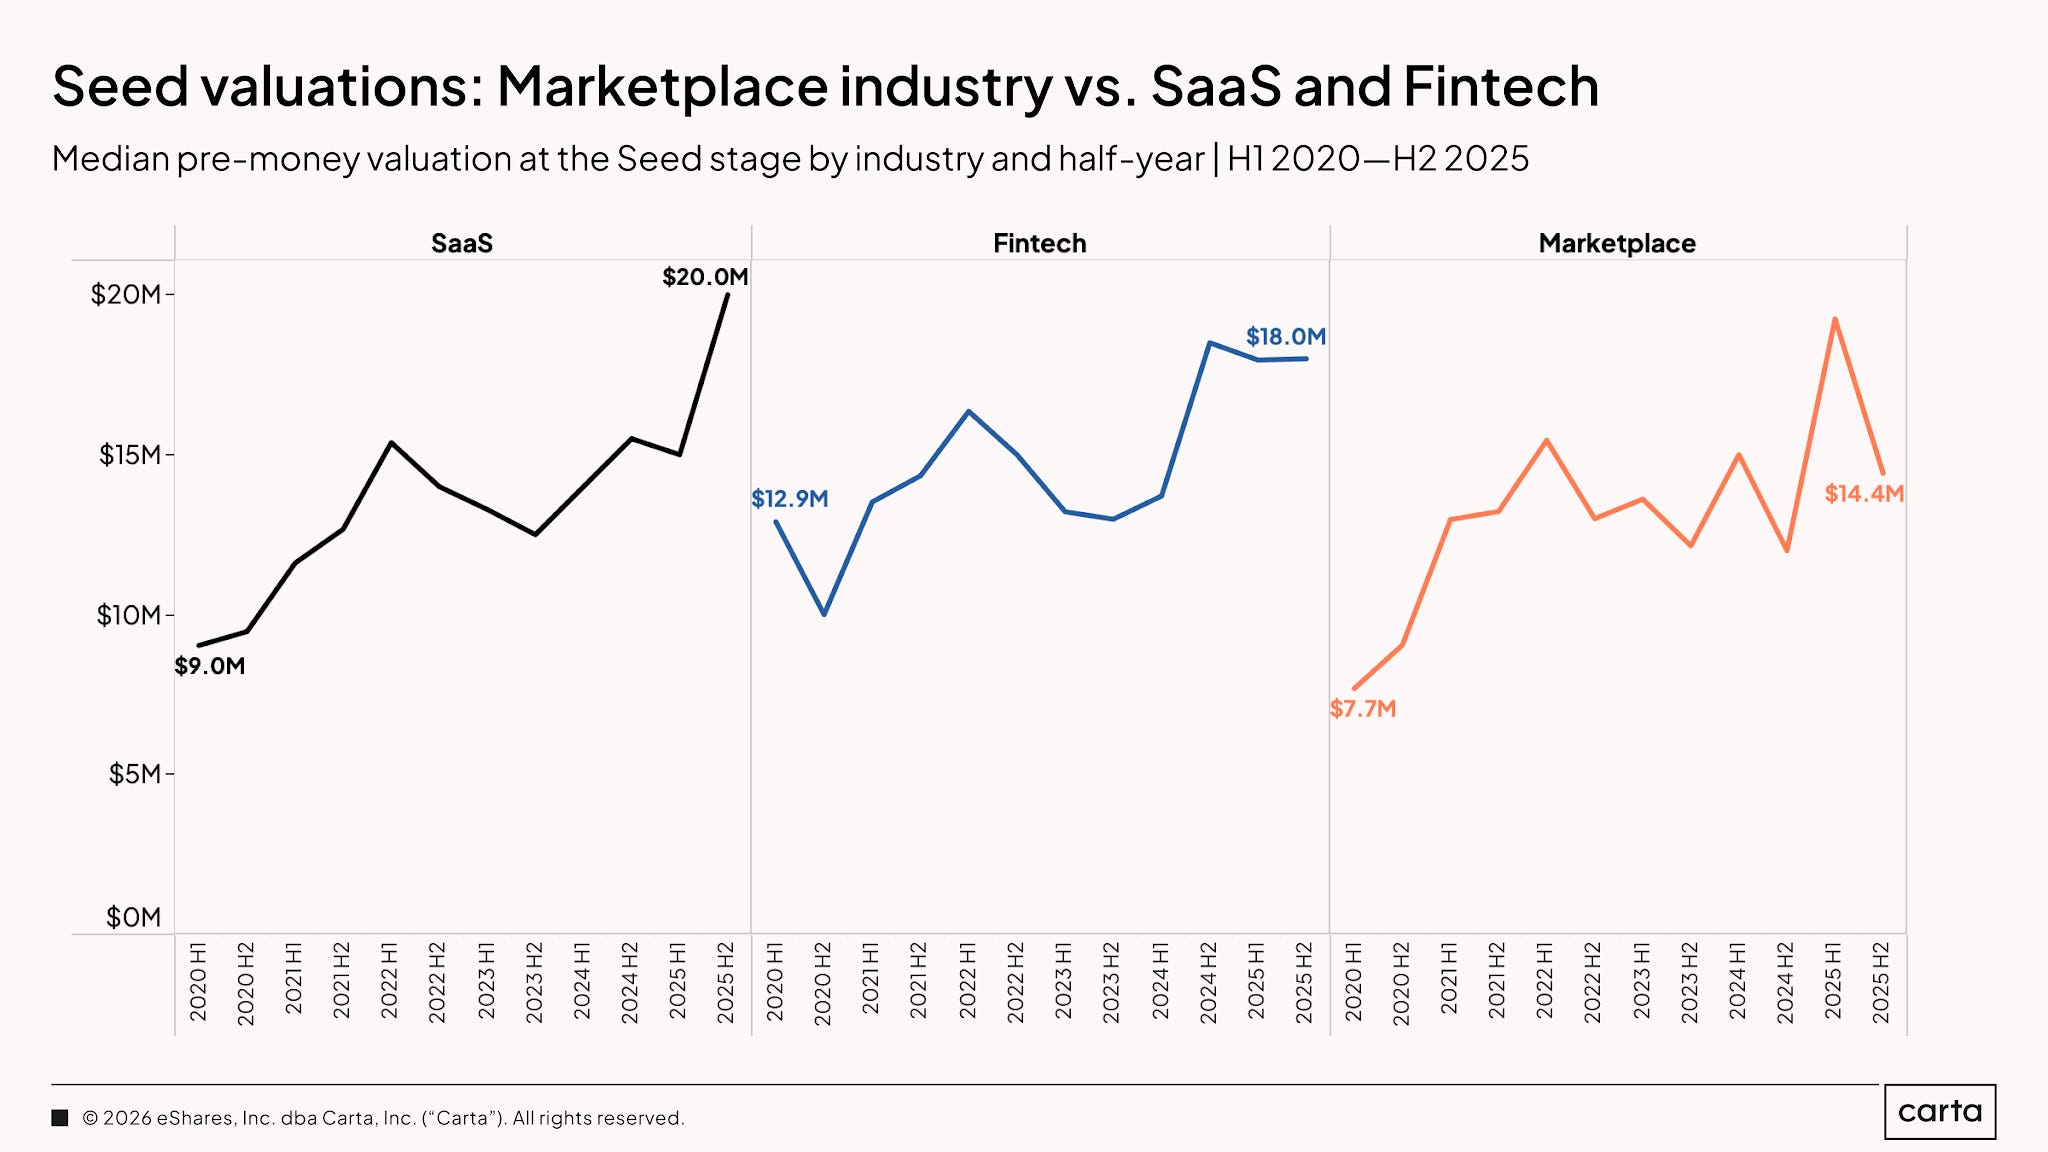
Median marketplace Seed valuations increased from $7.7M in H1 2020 to $14.4M in H2 2025 (+87%), although they remain below the $19M peak in H1 2025 (-24%). For comparison, SaaS increased from $9M to $20M (+122%) over the full period, while Fintech increased from $12.9M to $18M (+40%).
Seed looks tighter than Pre-Seed: round count is down 74% from the peak, average round size is down 43% from its peak, and median valuations have pulled back from their recent high. But both round size and valuation remain well above 2020 levels. The market is funding fewer Seed companies with smaller rounds than it did at the peak, while still pricing the companies that qualify at a substantial premium to 2020.
Series A Marketplace Fundraising Volume
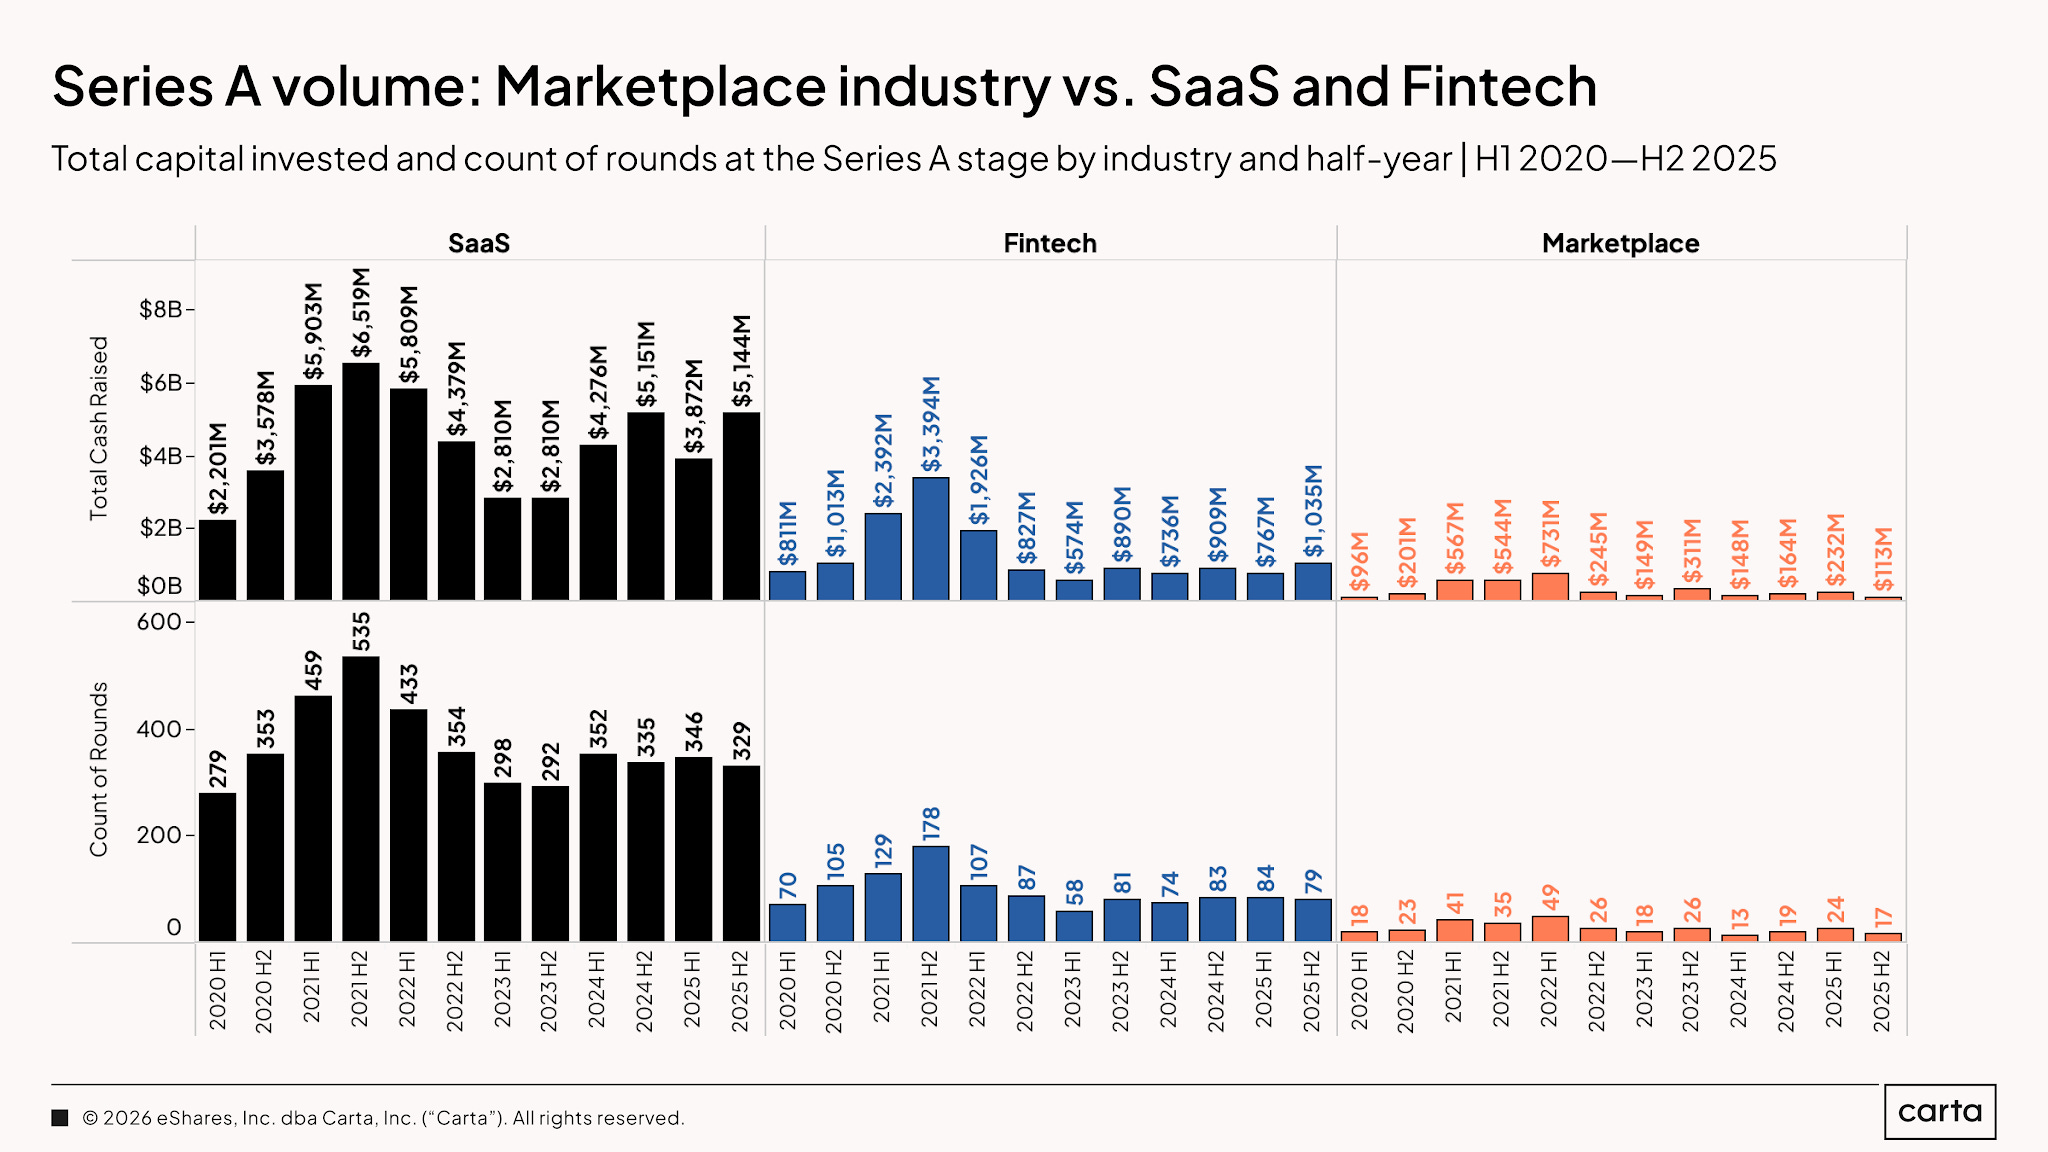
Marketplace Series A round count fell from a peak of 49 in H1 2022 to 17 in H2 2025 (-65%). Total capital invested fell from a peak of $751M in H1 2022 to $113M in H2 2025 (-85%). For comparison, from H1 2020 to H2 2025, SaaS round count rose from 279 to 329 (+18%) and capital invested rose from $2.2B to $5.1B (+134%), while Fintech round count rose from 70 to 79 (+13%) and capital invested rose from $811M to $1.0B (+30%). Series A activity has effectively returned to 2020 levels: round count moved from 18 in H1 2020 to 17 in H2 2025 (-6%), while capital invested rose from $96M to $113M (+18%). The difference is the path between those endpoints. Capital expanded more than sevenfold into 2022 before nearly all of that growth unwound.
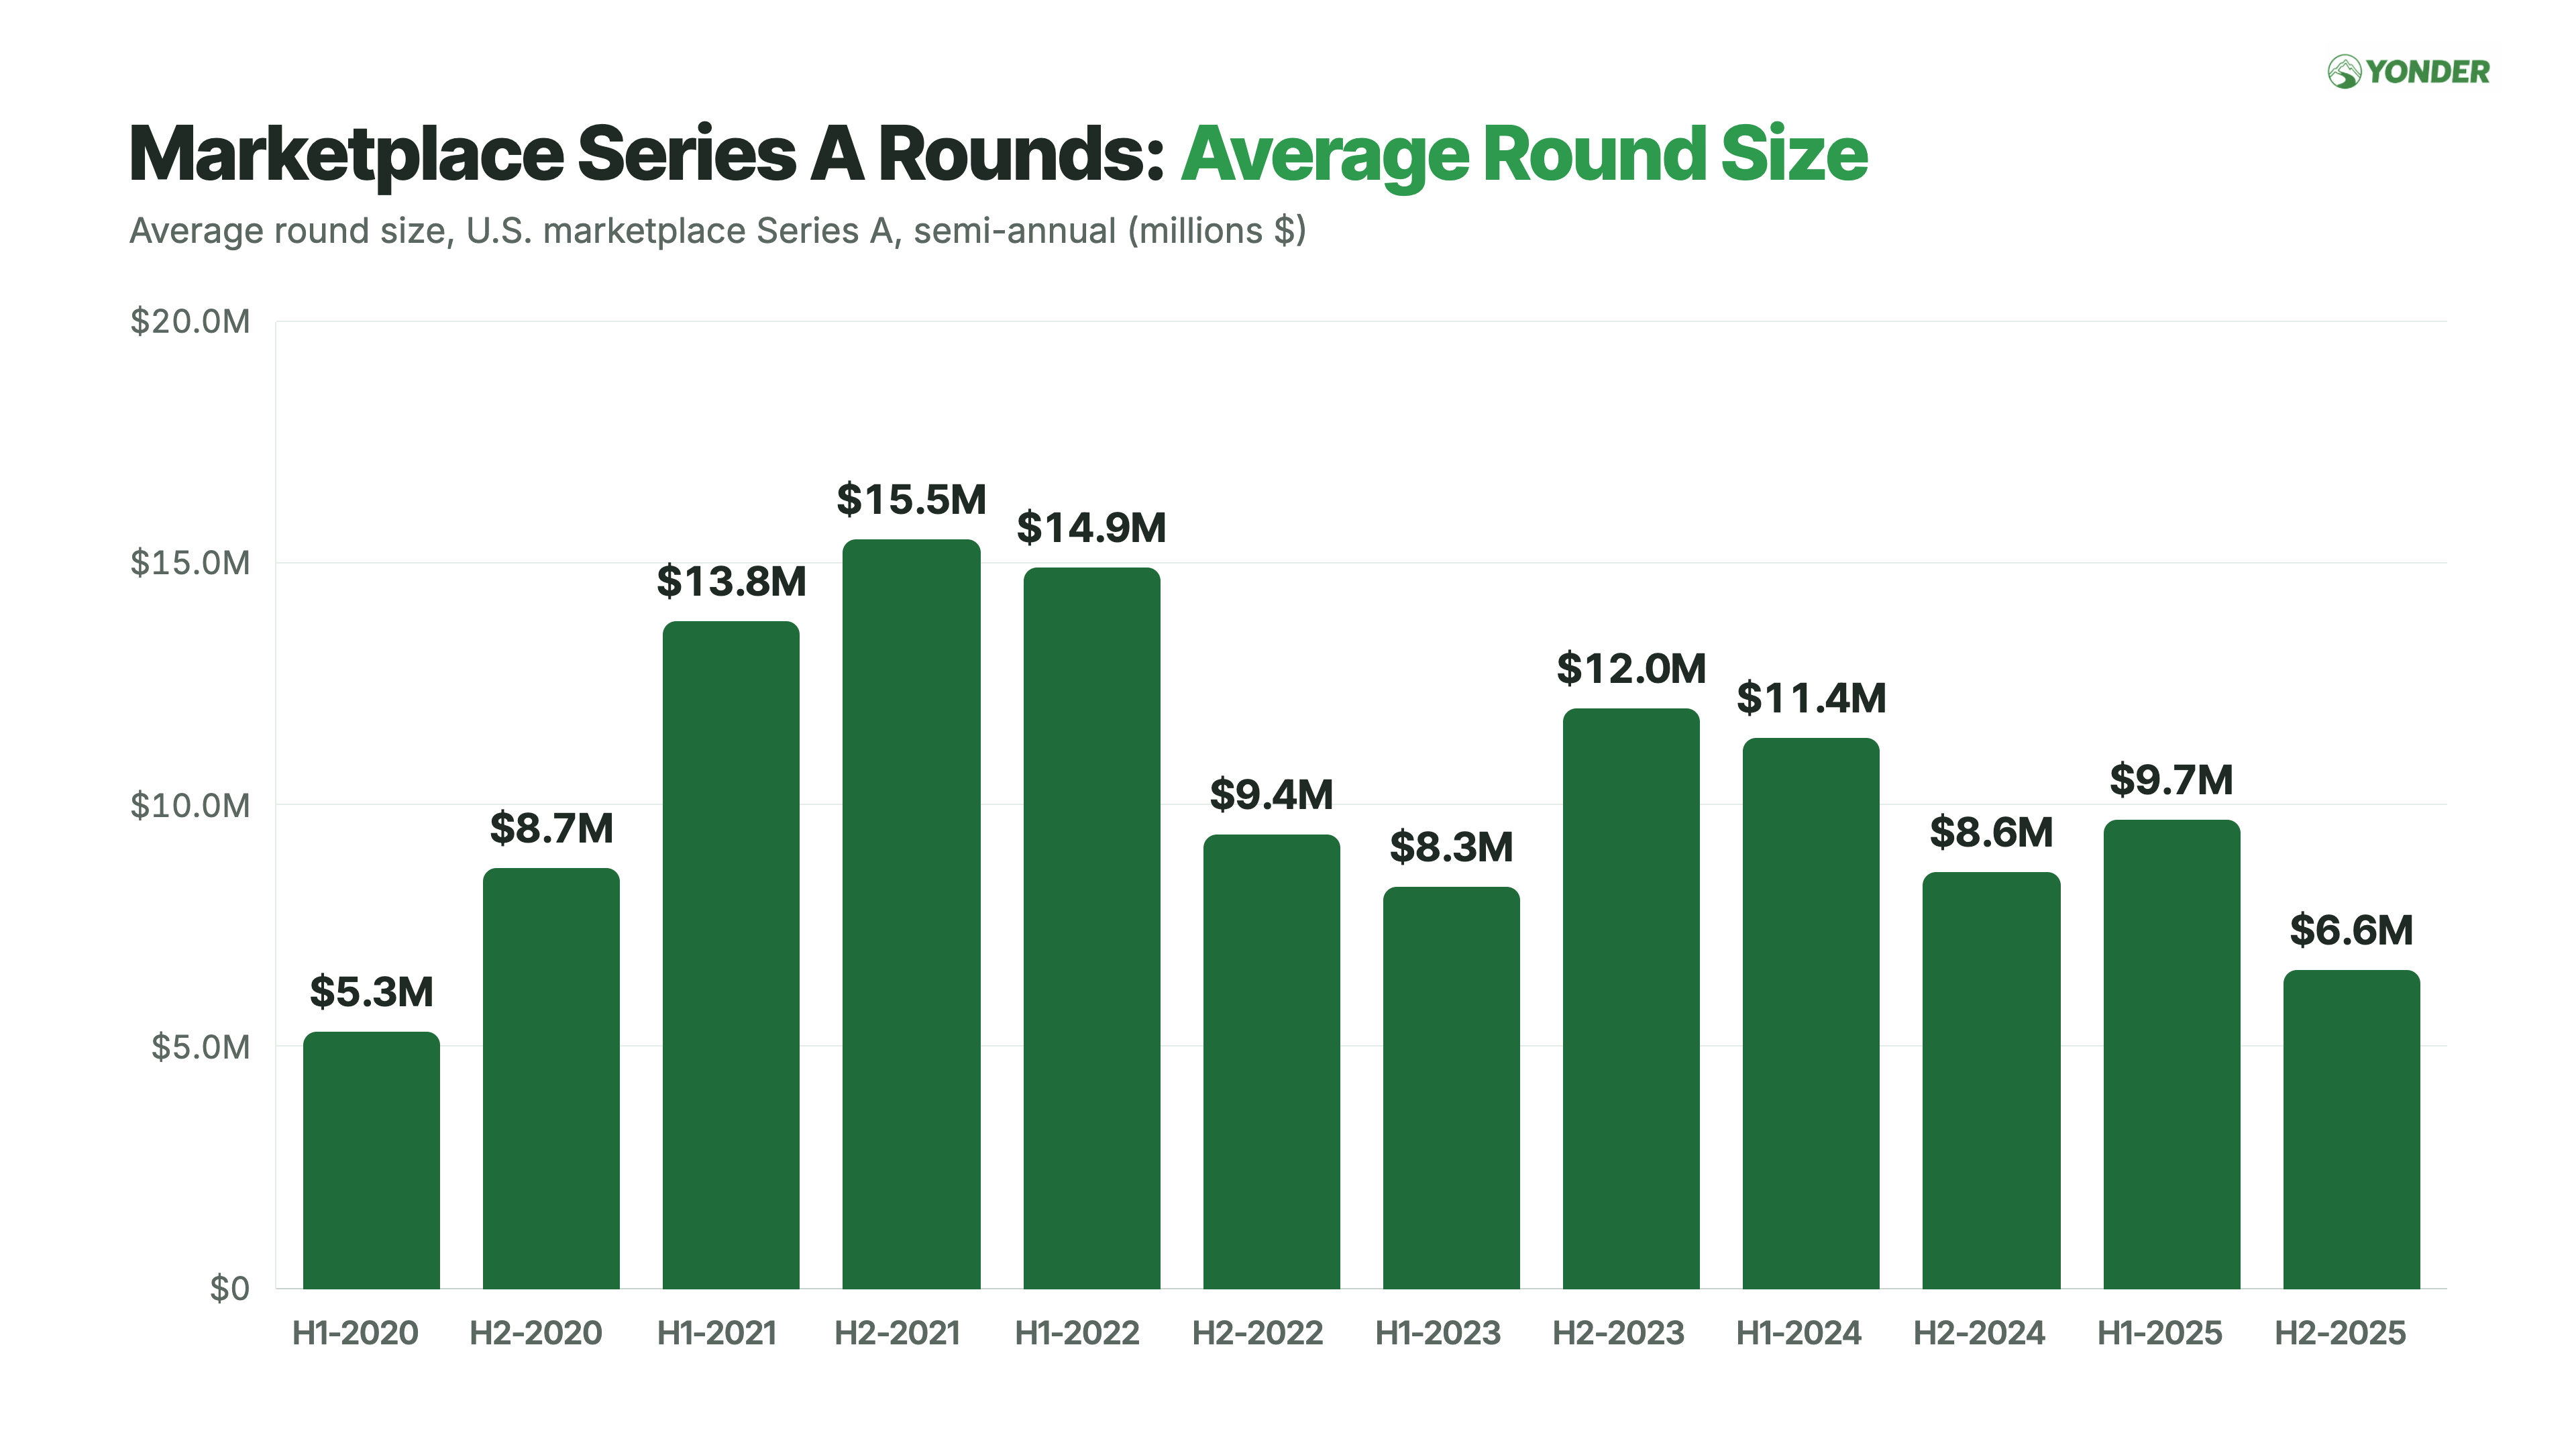
Average Series A round size rose from $5.3M in H1 2020 to $6.6M in H2 2025 (+25%) but remains below the $15.5M peak in H2 2021 (-57%). The market has tightened on both fronts, with fewer Series A rounds and smaller round sizes.
Series A Marketplace Fundraising Valuations
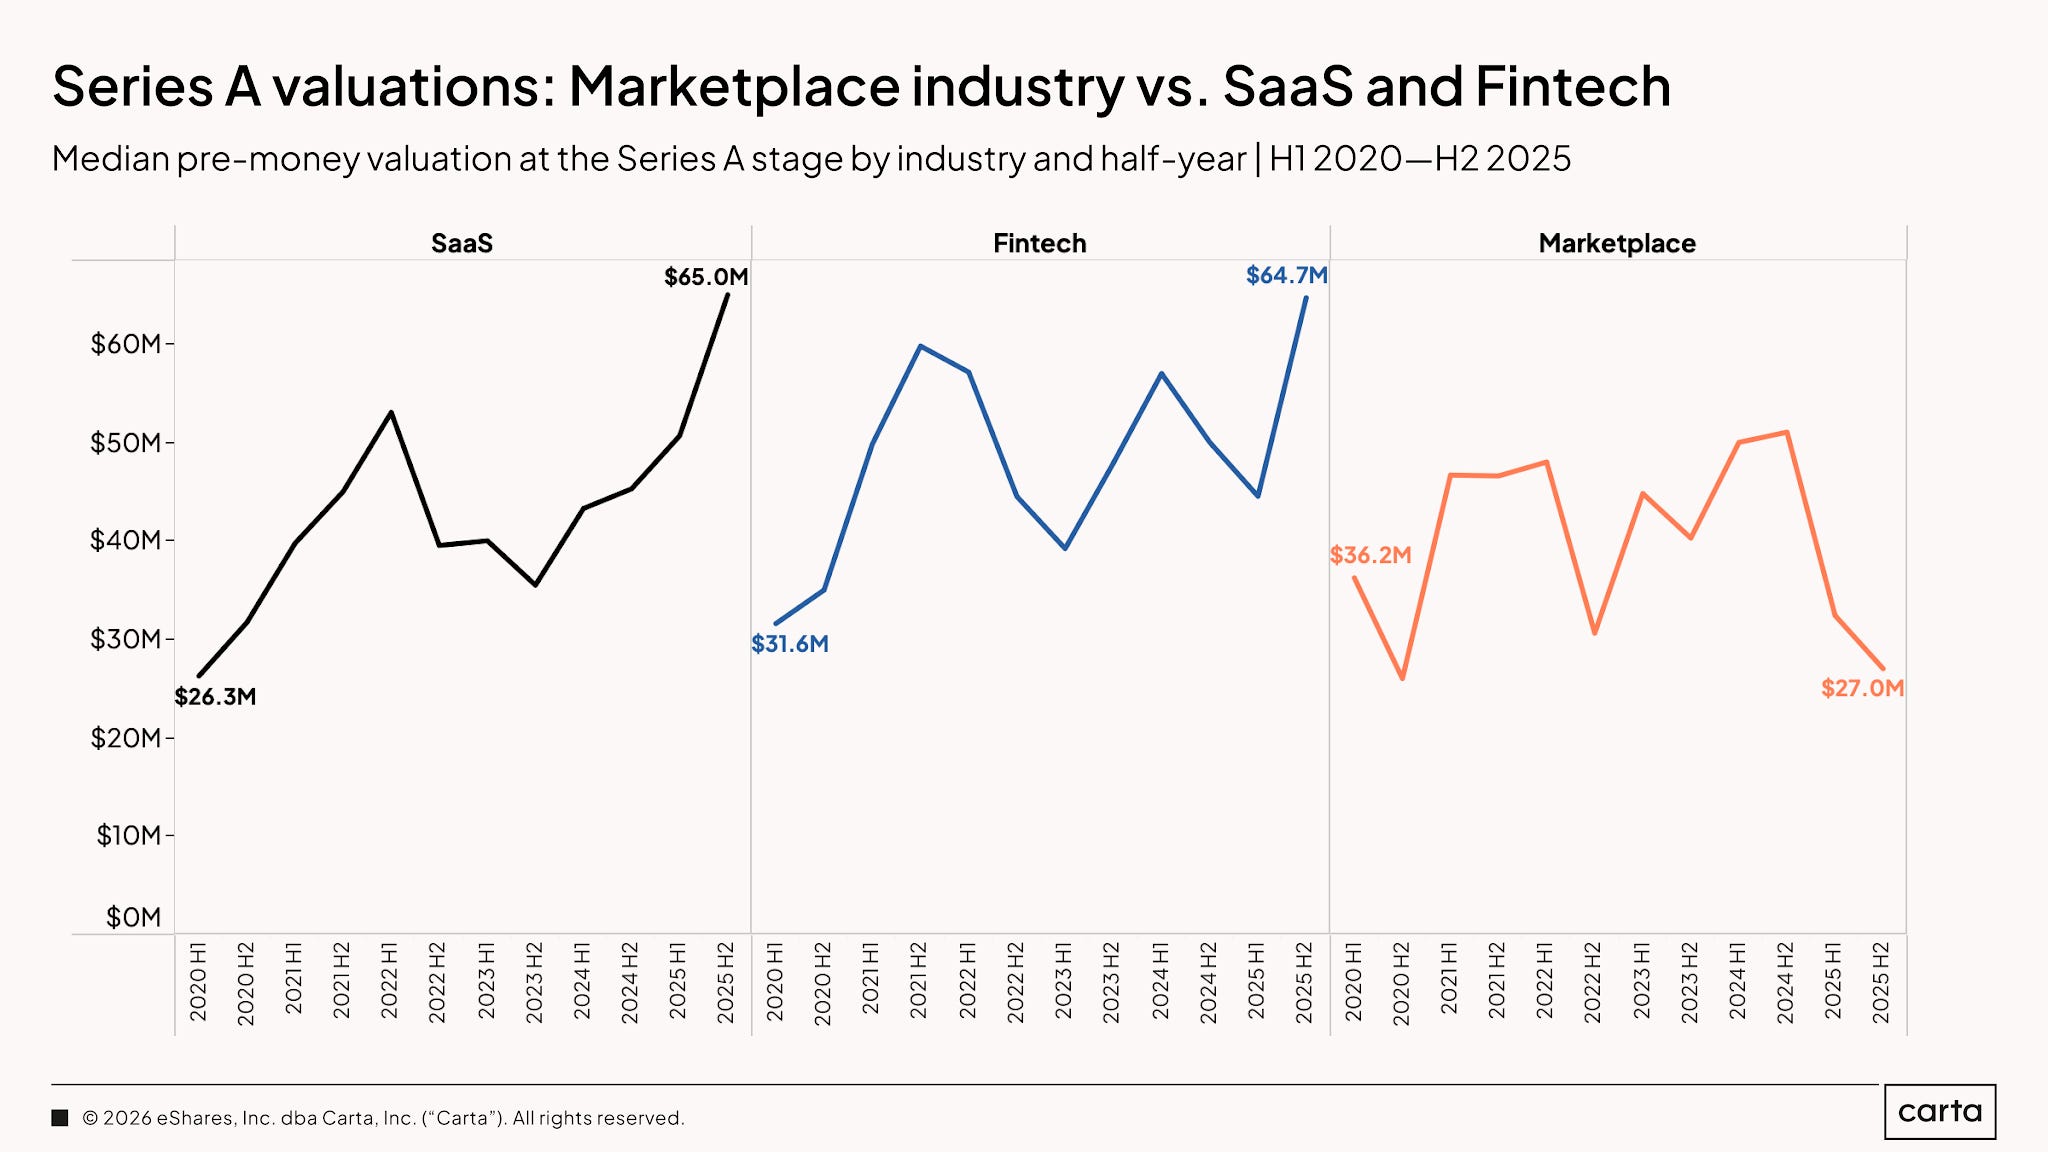
Median marketplace Series A valuations fell from $36.2M in H1 2020 to $27M in H2 2025 (-25%) and remain below the roughly $51M peak in H2 2024 (-47%). SaaS moved in the opposite direction, increasing from $26.3M to $65M (+147%) over the full period, while Fintech increased from $31.6M to $64.7M (+105%).
Series A is the clear break from the earlier stages: round count is down 65% from the peak, total capital is down 85%, average round size is down 57%, and median valuations are now below where they started in 2020. Fewer companies are getting through, rounds are smaller, and valuations are lower. That is why the jump from Seed to Series A has become the hardest part of the fundraising journey for marketplace founders.
Series B Marketplace Fundraising Volume
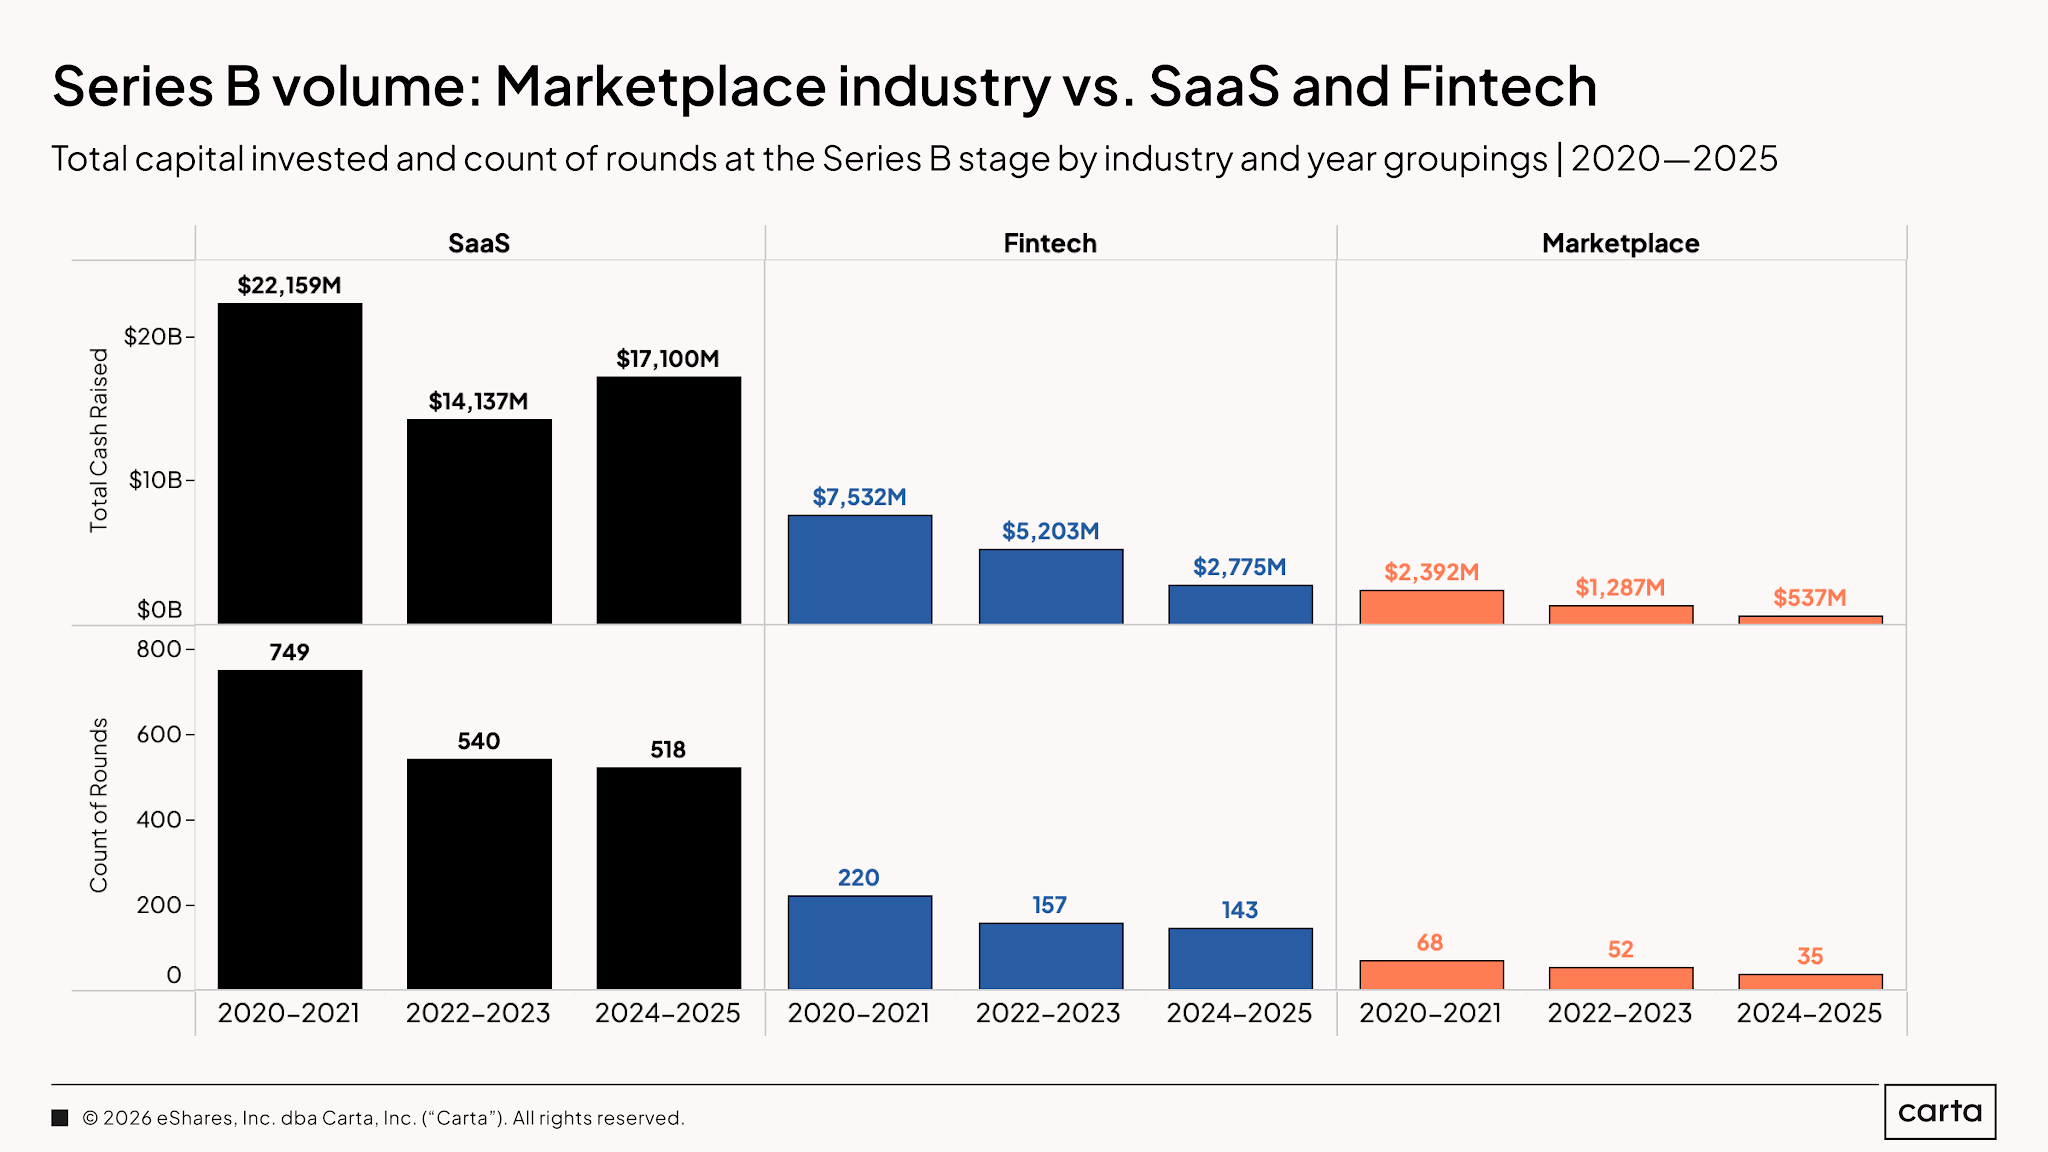
Marketplace round count fell from 68 in 2020–2021 to 35 in 2024–2025 (-49%), while total capital invested fell from $2.4B to $537M (-78%). For comparison, from 2020–2021 to 2024–2025, SaaS round count fell from 749 to 518 (-31%) and capital invested fell from $22.2B to $17.1B (-23%), while Fintech round count fell from 220 to 143 (-35%) and capital invested fell from $7.5B to $2.8B (-63%). The Series B funnel has narrowed substantially across each period.
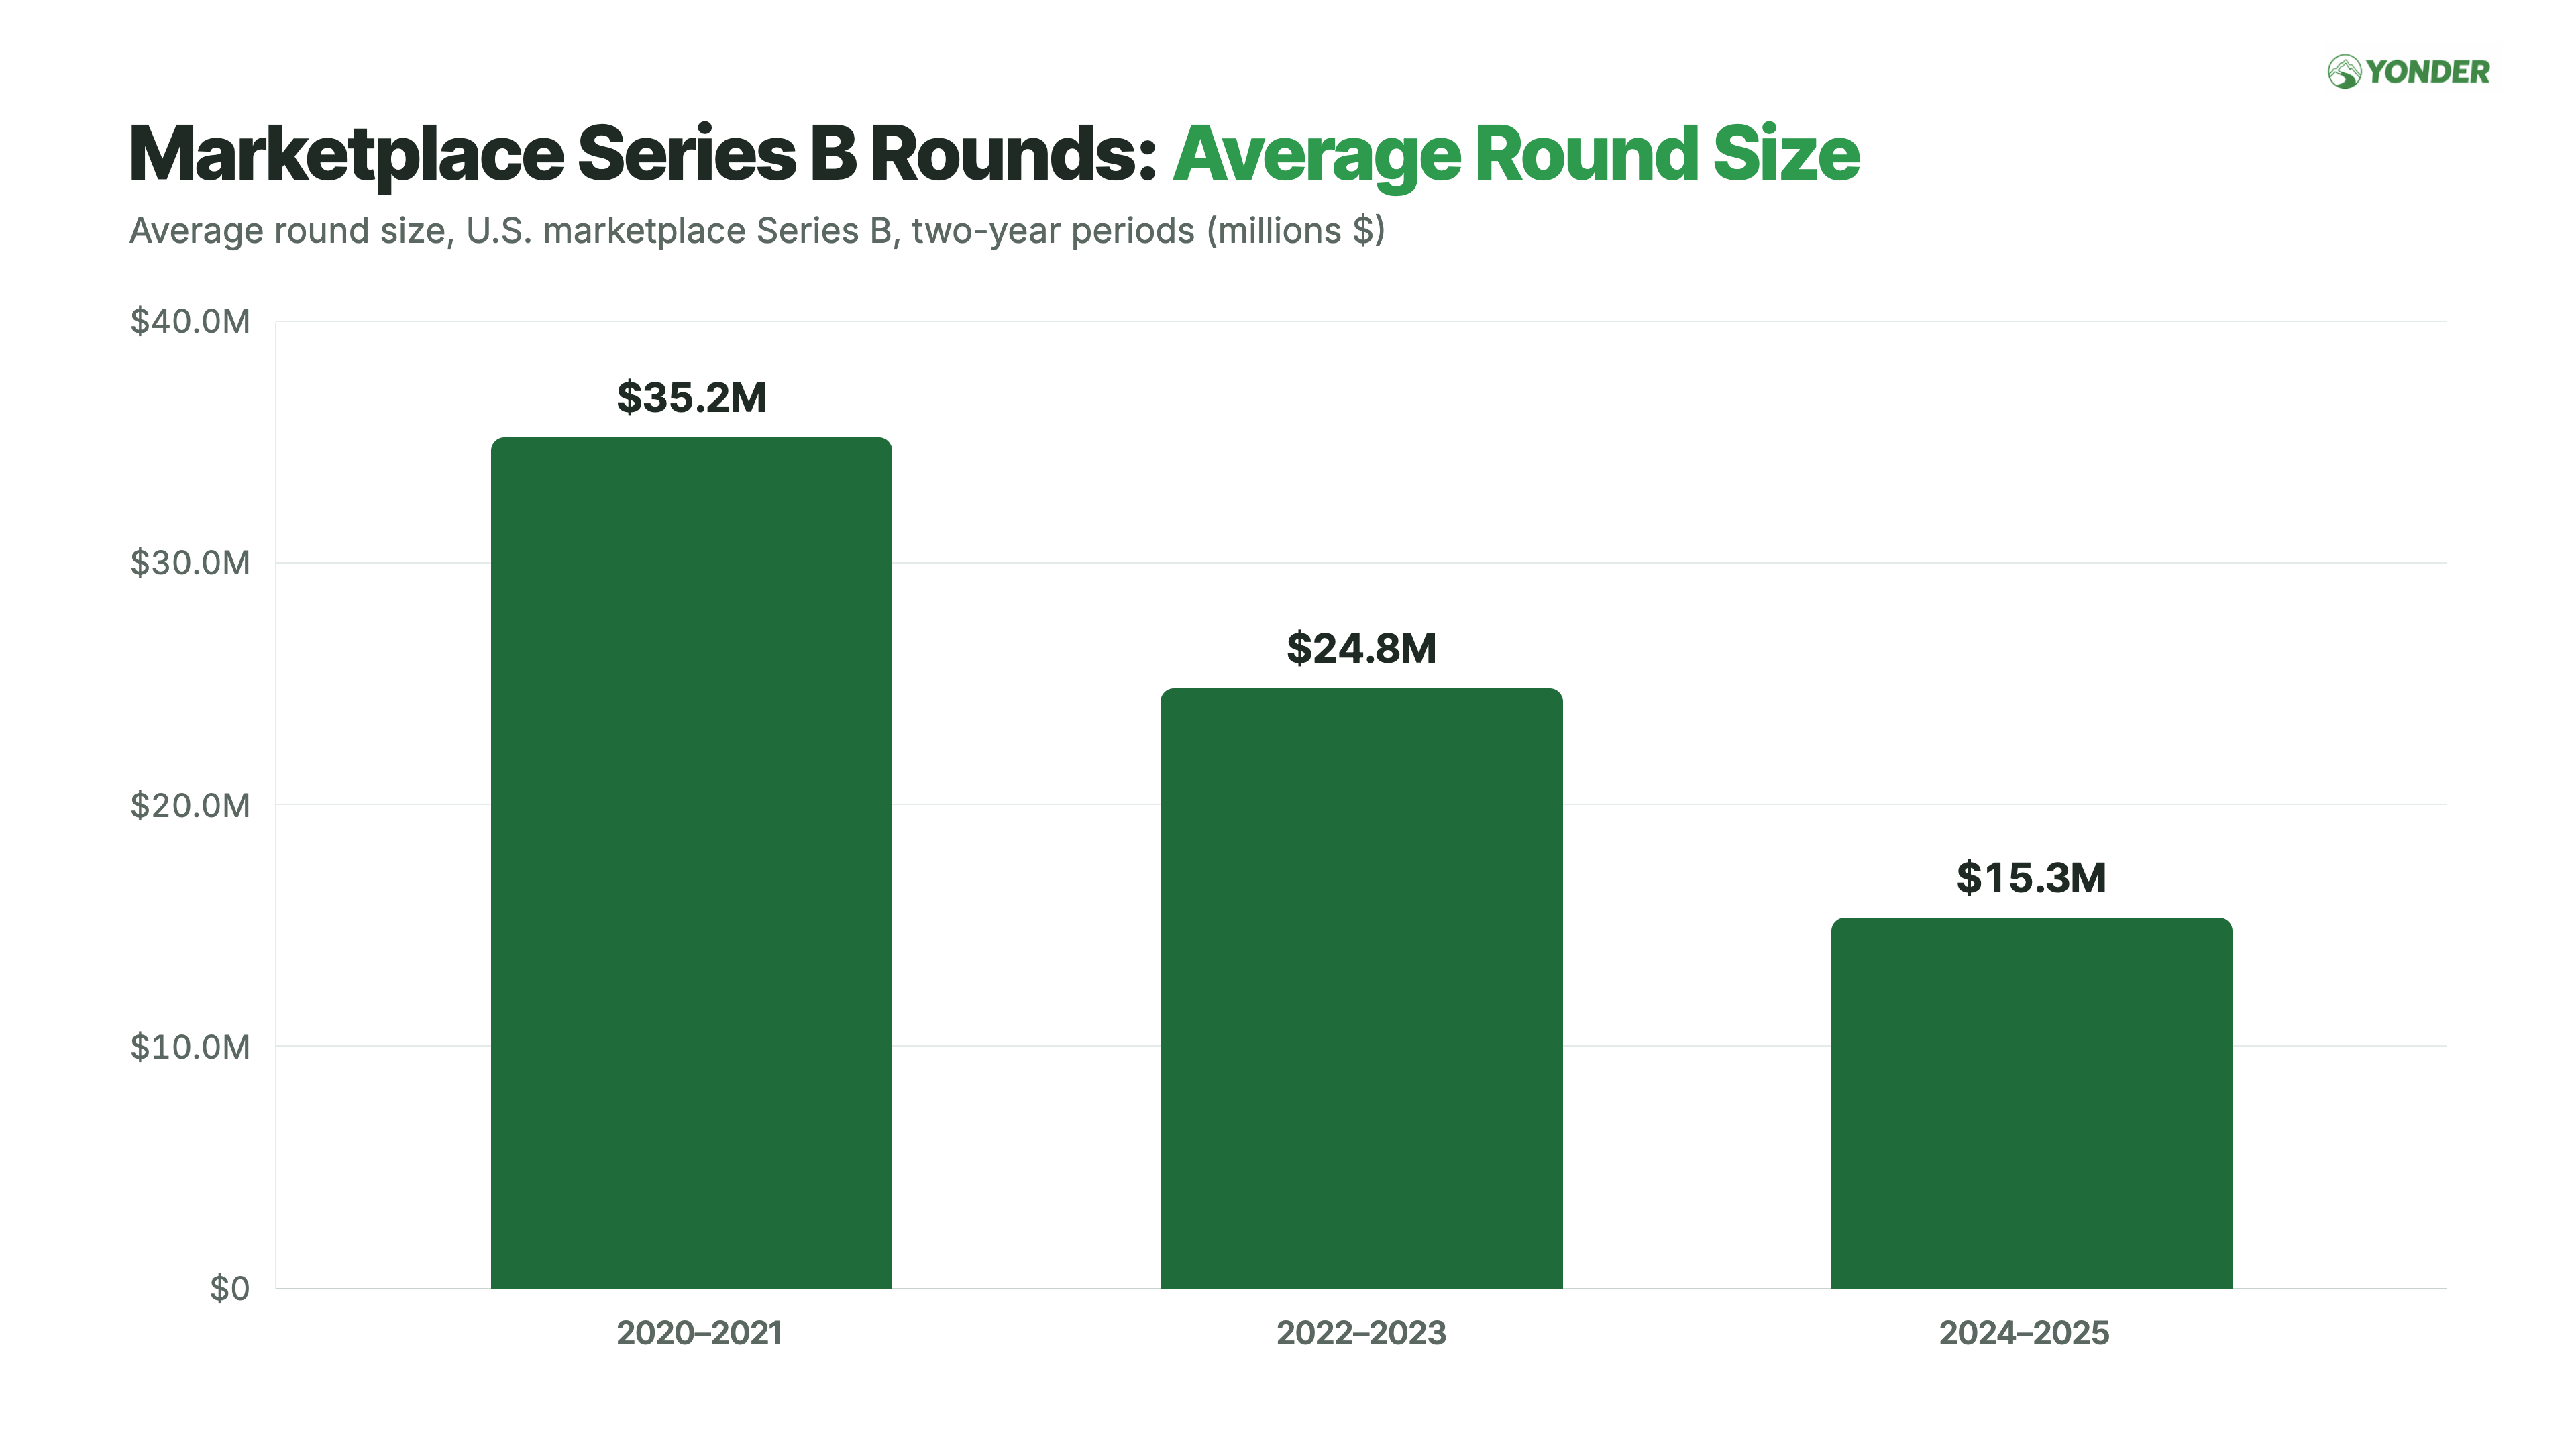
Average Series B investment size fell from $35.2M in 2020–2021 to $15.3M in 2024–2025 (-57%). Unlike Pre-Seed and Seed, the decline in capital at Series B reflects both fewer rounds and a sustained reduction in average round size.
Series B Marketplace Fundraising Valuations
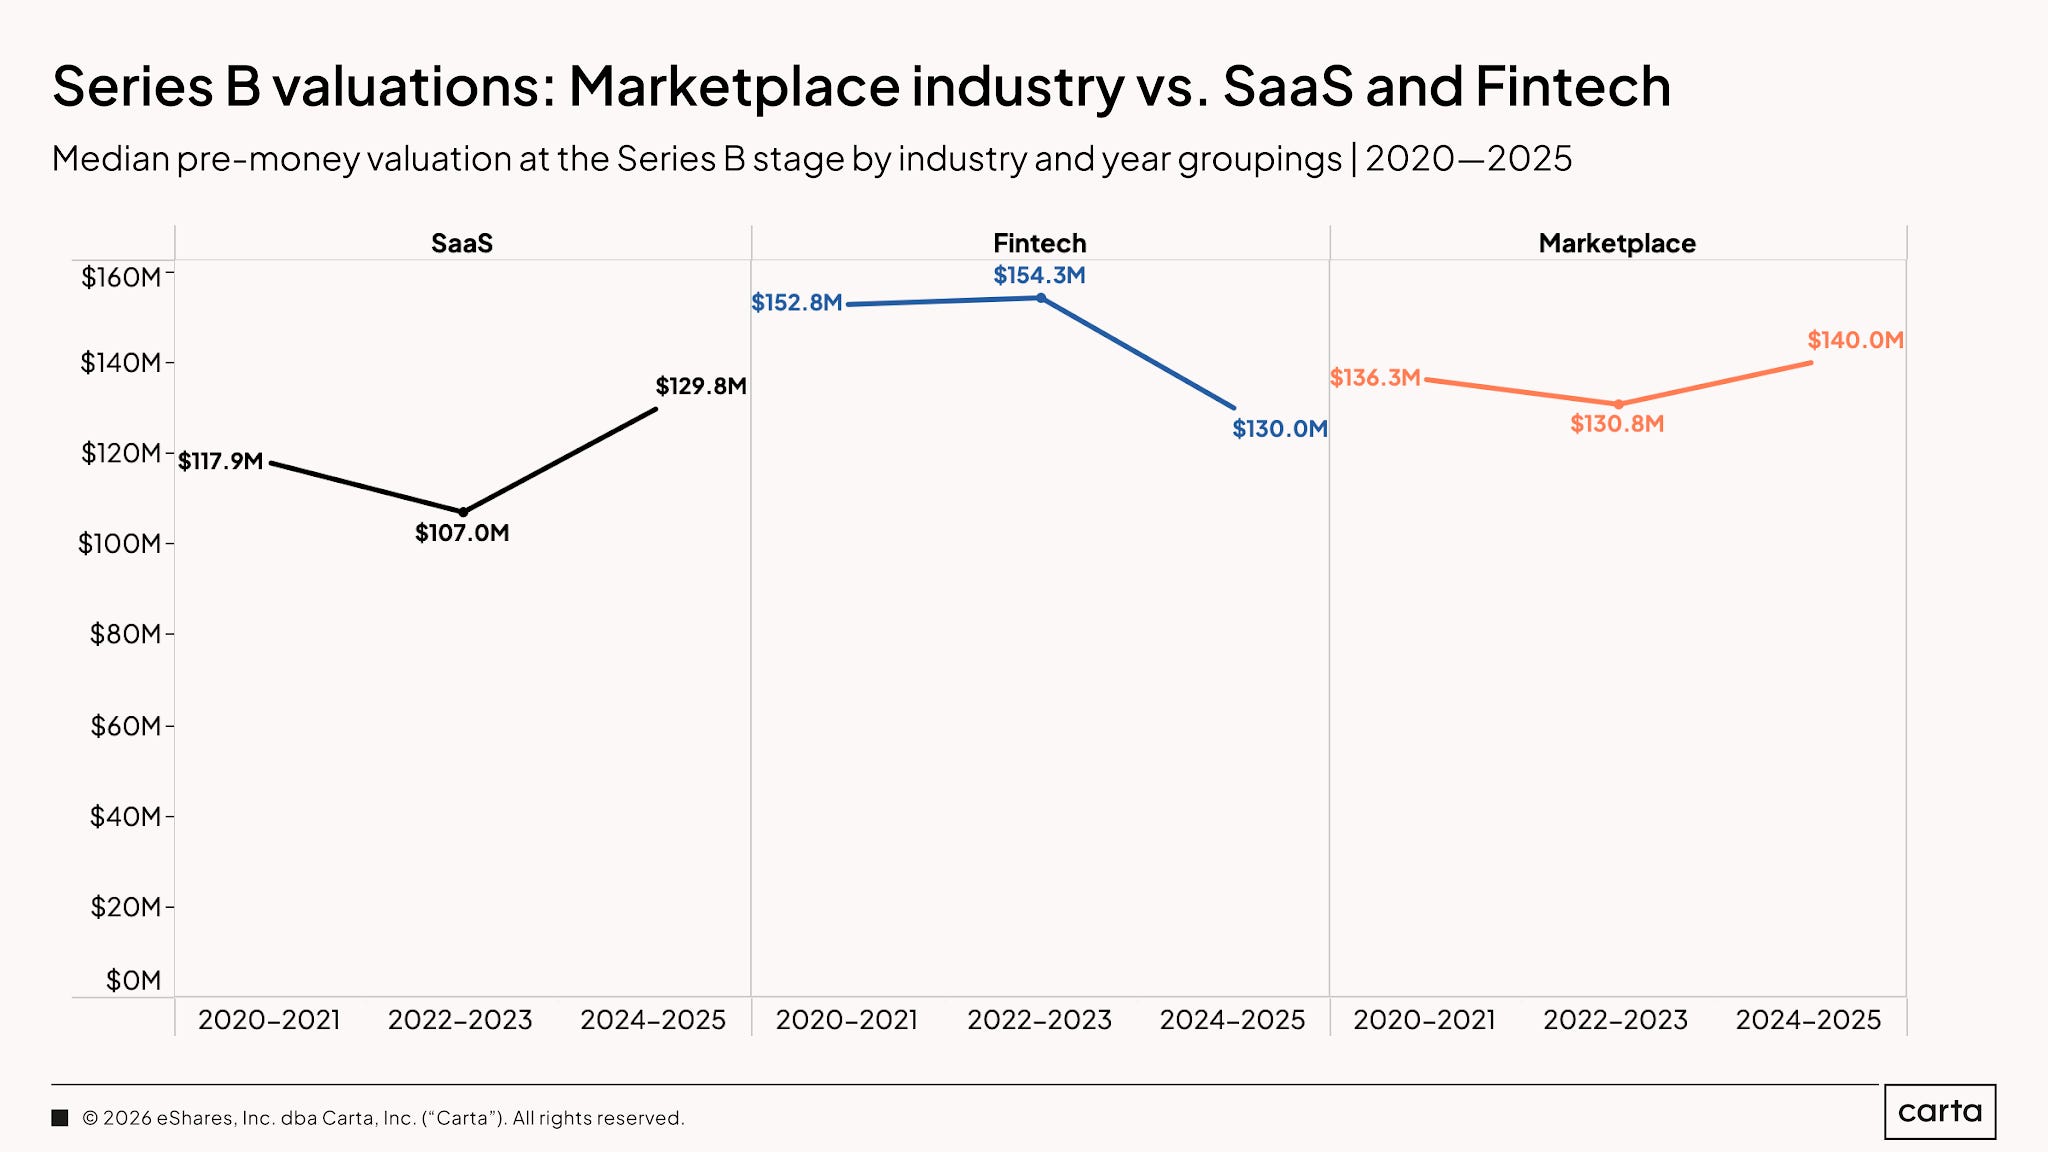
Median marketplace Series B valuations increased from $136.3M in 2020–2021 to $140M in 2024–2025 (+3%) after dipping to $130.8M in 2022–2023. Marketplace now sits above SaaS at $129.8M and Fintech at $130M. Over the full period, SaaS increased from $117.9M to $129.8M (+10%), while Fintech declined from $152.8M to $130M (-15%).
Series B shows the sharpest version of the selection effect: round count is down 49%, total capital is down 78%, and average round size is down 57%, but median valuations are slightly higher than they were in 2020–2021 and now lead both comparison categories. Far fewer marketplace companies are reaching Series B, but the ones that do are still being valued like high-quality growth businesses. Series B is still open for the companies that make it through. Getting there is the hard part.
Dilution: The Hidden Story
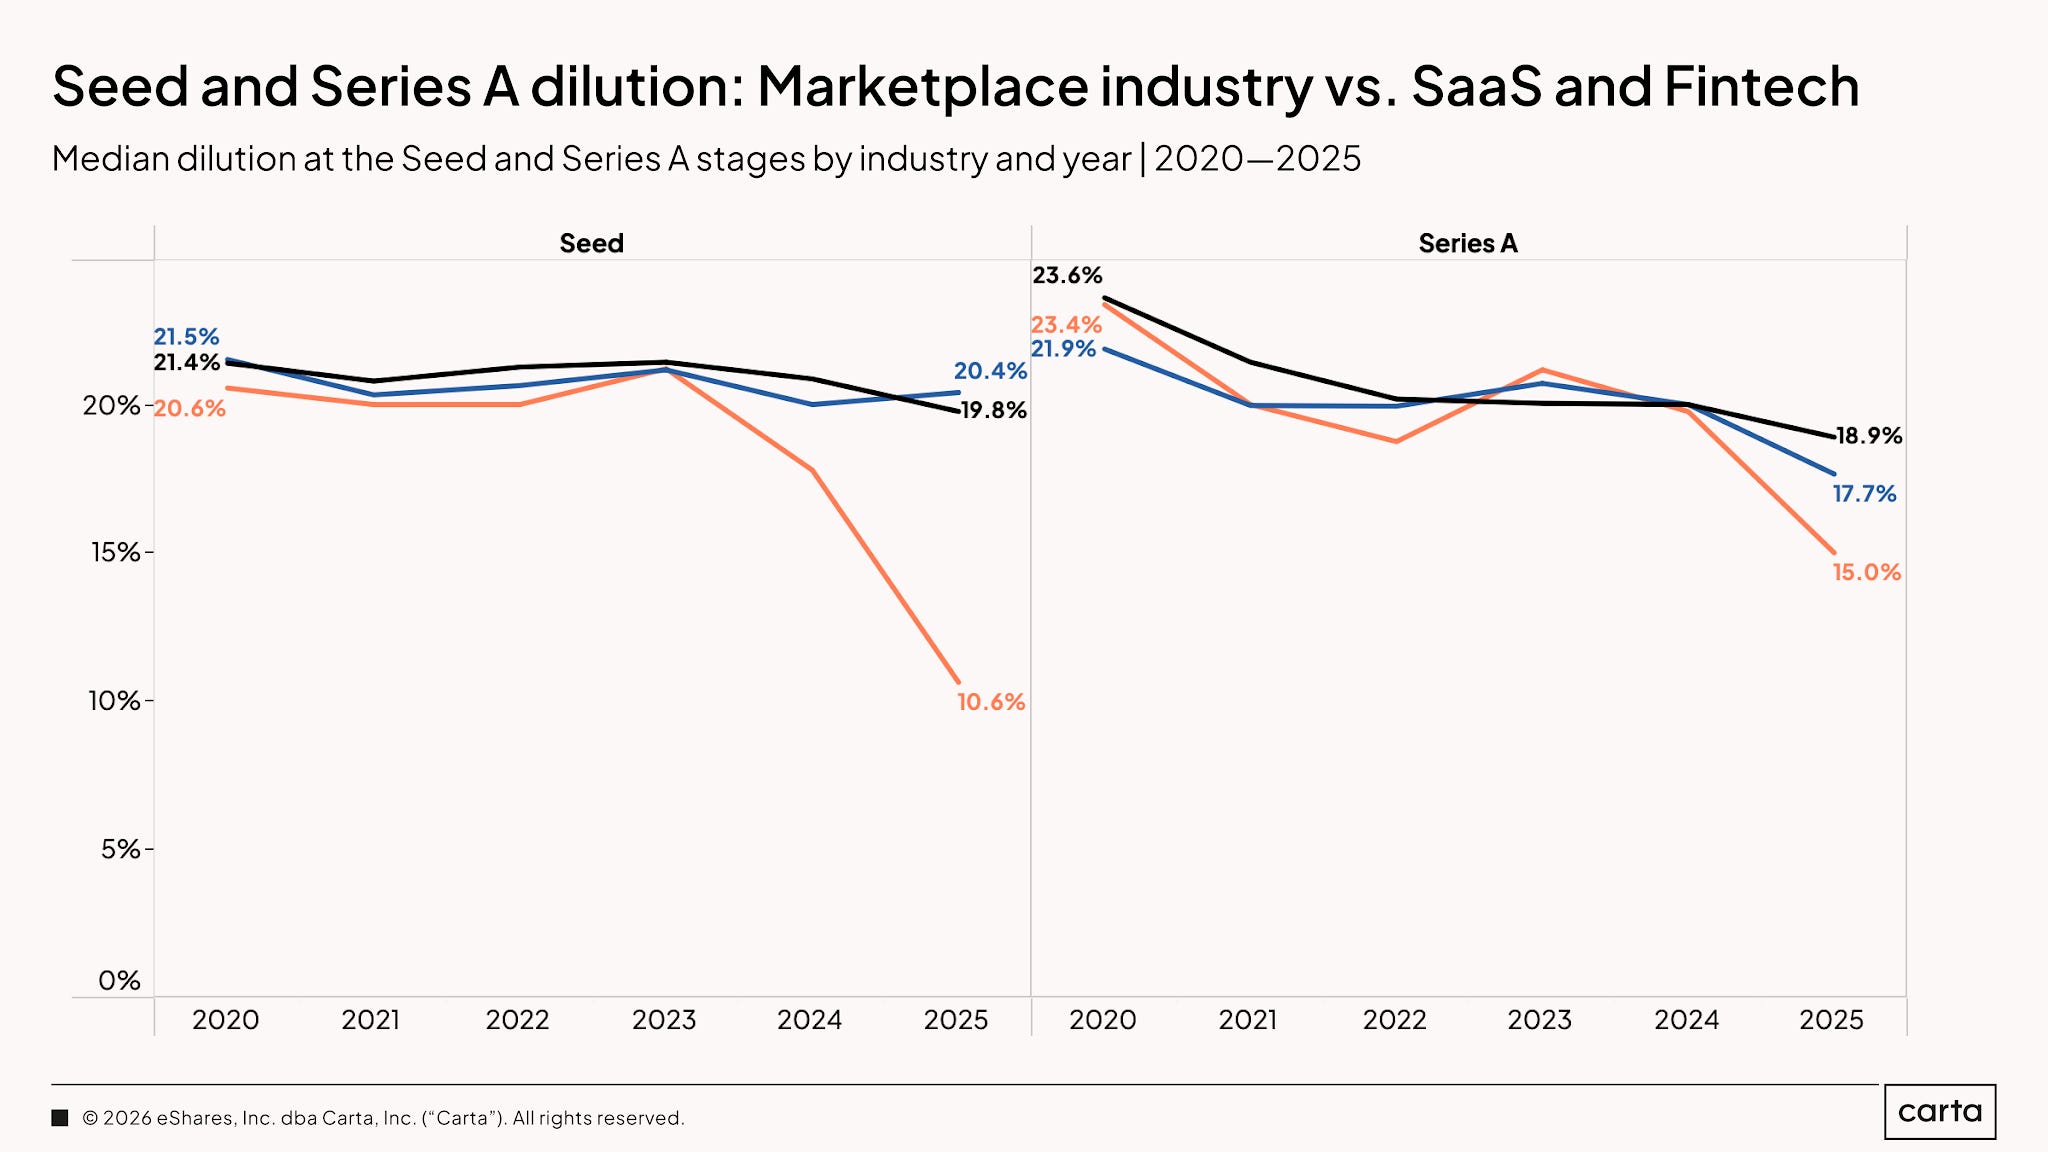
This year’s data includes dilution for the first time, and marketplaces stand out. In 2025, marketplace Seed dilution was 10.6%, versus 20.4% for Fintech and 19.8% for SaaS. At Series A, it was 15.0%, versus 17.7% and 18.9%, respectively.
This cuts against the conventional wisdom that marketplaces are more capital-intensive. I see two possible explanations.
First, marketplaces may enter these rounds with stronger revenue traction: transactions monetize immediately, whereas SaaS and Fintech companies may sometimes raise on usage, pilots, or product adoption before monetization catches up. Marketplace founders may therefore need less capital relative to valuation.
Second, marketplace founders may be unable to raise more because investor interest in marketplaces remains weak. In that case, the smaller rounds and lower dilution say less about marketplaces being inherently capital efficient and more about how much capital investors are willing to put into the category.
Either way, lower dilution only helps if the round funds the next milestone. In this market, “efficient” and “underfunded” can look identical until it is too late.
Summarizing Marketplace Fundraising in 2026
So what is the takeaway from all of this for marketplaces? Here is the tl;dr:
Pre-Seed
Dollar Volume: Falling ⬇️
Instrument Volume: Falling ⬇️
Valuation Caps: Holding Up ➡️
Seed
Dollar Volume: Falling, With a Recent Bounce ⬇️
Deal Volume: Falling ⬇️
Pre-Money Valuations: Holding Up ➡️
Series A
Dollar Volume: Falling ⬇️
Deal Volume: Falling ⬇️
Pre-Money Valuations: Falling ⬇️
Series B
Dollar Volume: Falling ⬇️
Deal Volume: Falling ⬇️
Pre-Money Valuations: Flat ➡️
The marketplace fundraising market has not broadly “recovered,” but frankly, this might just be a return to normal. Pre-Seed and Seed still offer good terms to the companies that clear the bar, but far fewer companies are getting funded. Series A is the choke point: fewer rounds, less capital, smaller round sizes, and lower valuations. Series B still rewards the survivors, but far fewer companies are making it there.
The category is definitely not dead. The market is much more selective, and founders need more revenue, liquidity, and capital efficiency to raise the same round they could have raised with less proof in 2021 or 2022.
So now let’s talk about fundamentals: revenue…
Revenue Requirements: The Bar Keeps Rising
SVB’s H1 2026 State of the Markets report provides two related views of the fundraising bar. The first compares top-quartile revenue growth and median revenue at the time of a round in 2021 versus 2025. These are benchmarks for US VC-backed tech companies, not marketplace-specific, to be clear.
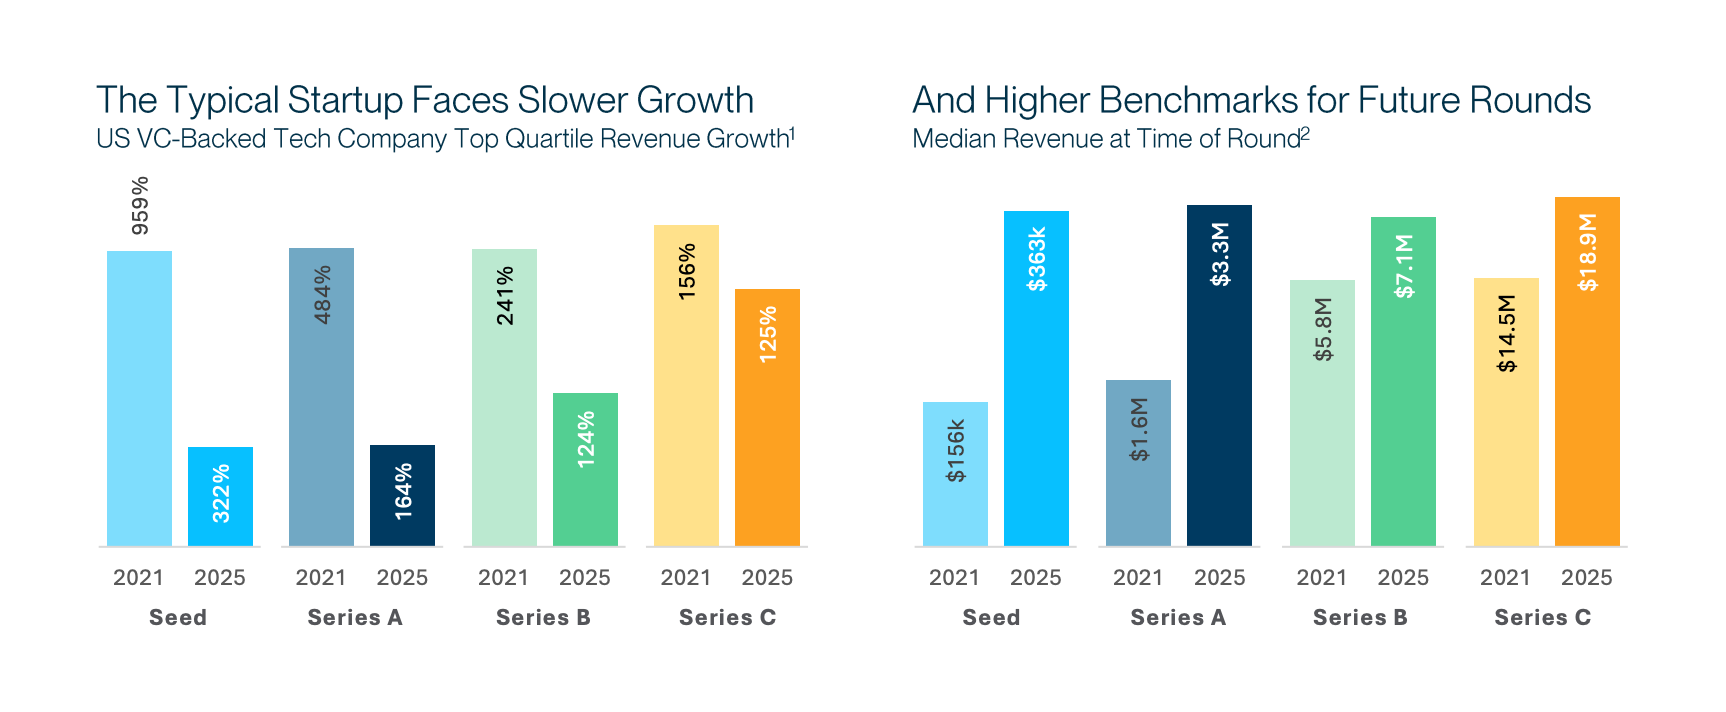
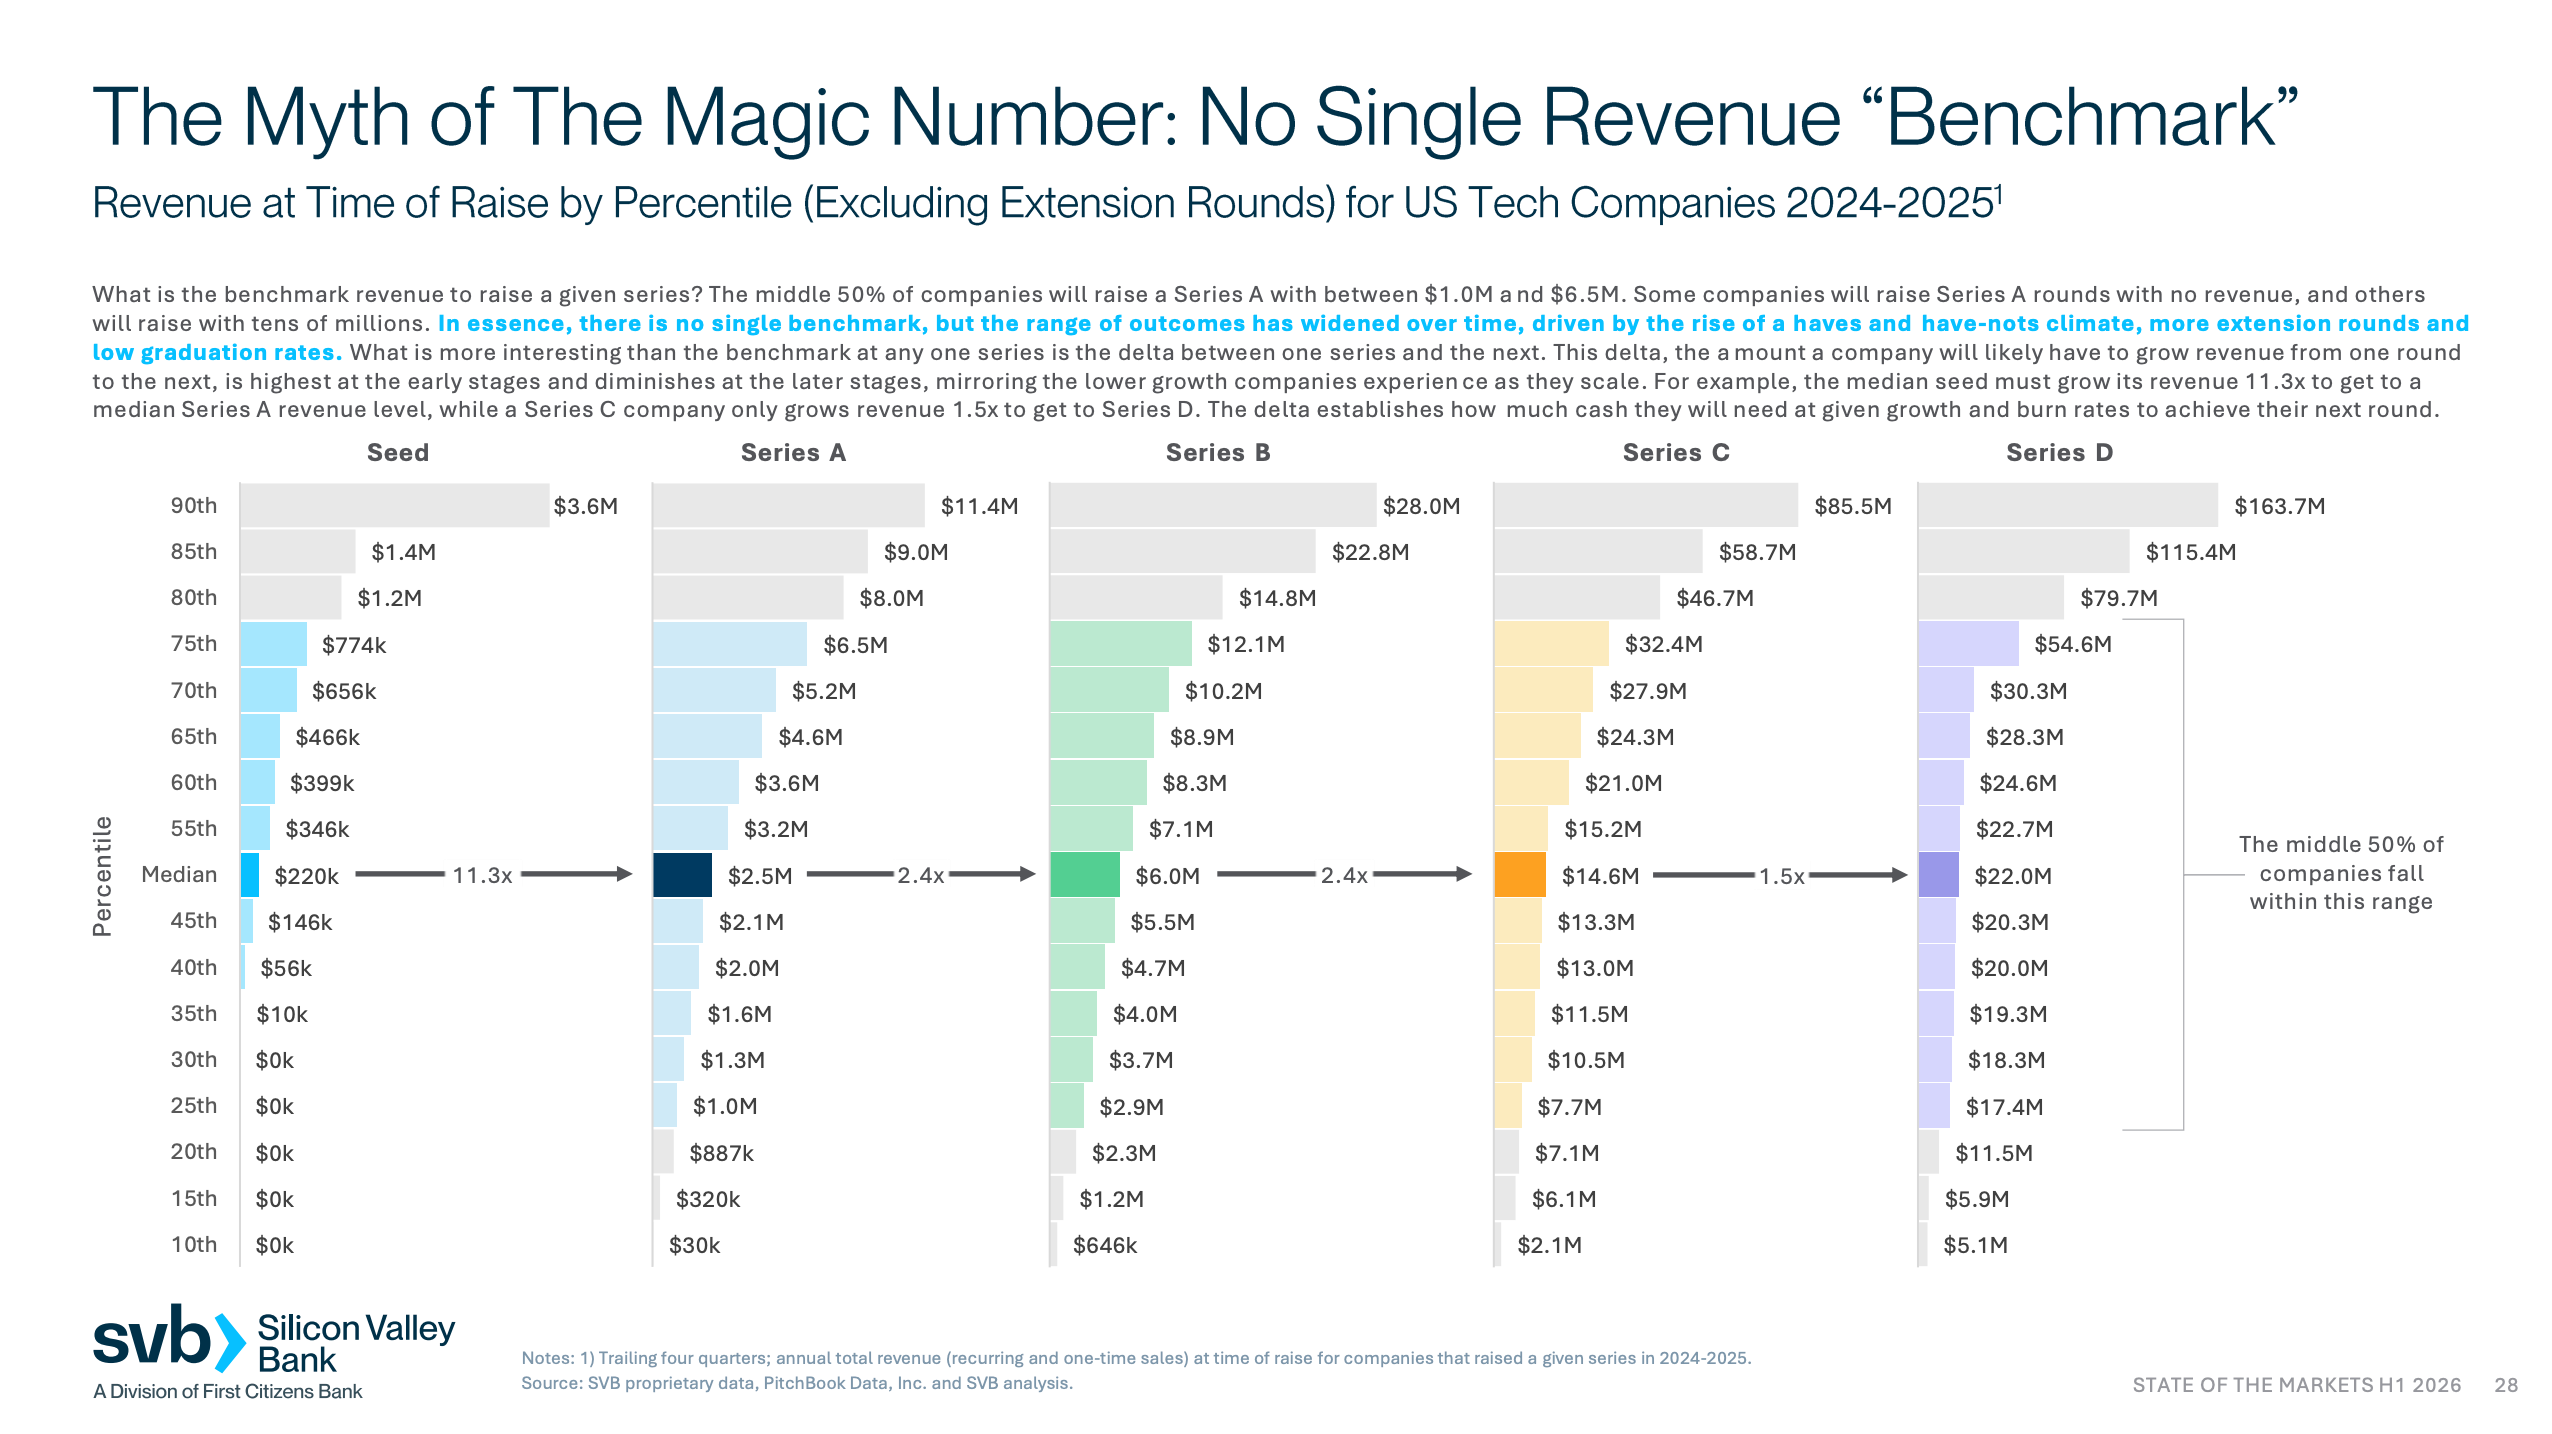
Top-quartile growth fell sharply from 2021 to 2025: from 959% to 322% at Seed, from 484% to 164% at Series A, from 241% to 124% at Series B, and from 156% to 125% at Series C. At the same time, median revenue at the round increased from $156K to $363K at Seed (+133%), $1.6M to $3.3M at Series A (+106%), $5.8M to $7.1M at Series B (+22%), and $14.5M to $18.9M at Series C (+30%). Companies are raising at slower growth rates, but at Seed and Series A, they are doing so with roughly twice the revenue.
These are reference points, not hard-and-fast thresholds. The full SVB distribution below shows why: companies raise capital across a very wide range of revenue outcomes, including some Series A rounds with little or no revenue and others with tens of millions in revenue. The middle 50% of Series A companies spans roughly $1M to $6.5M in annual revenue.
For marketplace founders, the practical translation is GMV. Using the 2024–2025 cohort of US tech companies that raised without an extension round, the median revenue levels translate as follows using 10% and 15% take-rate assumptions.
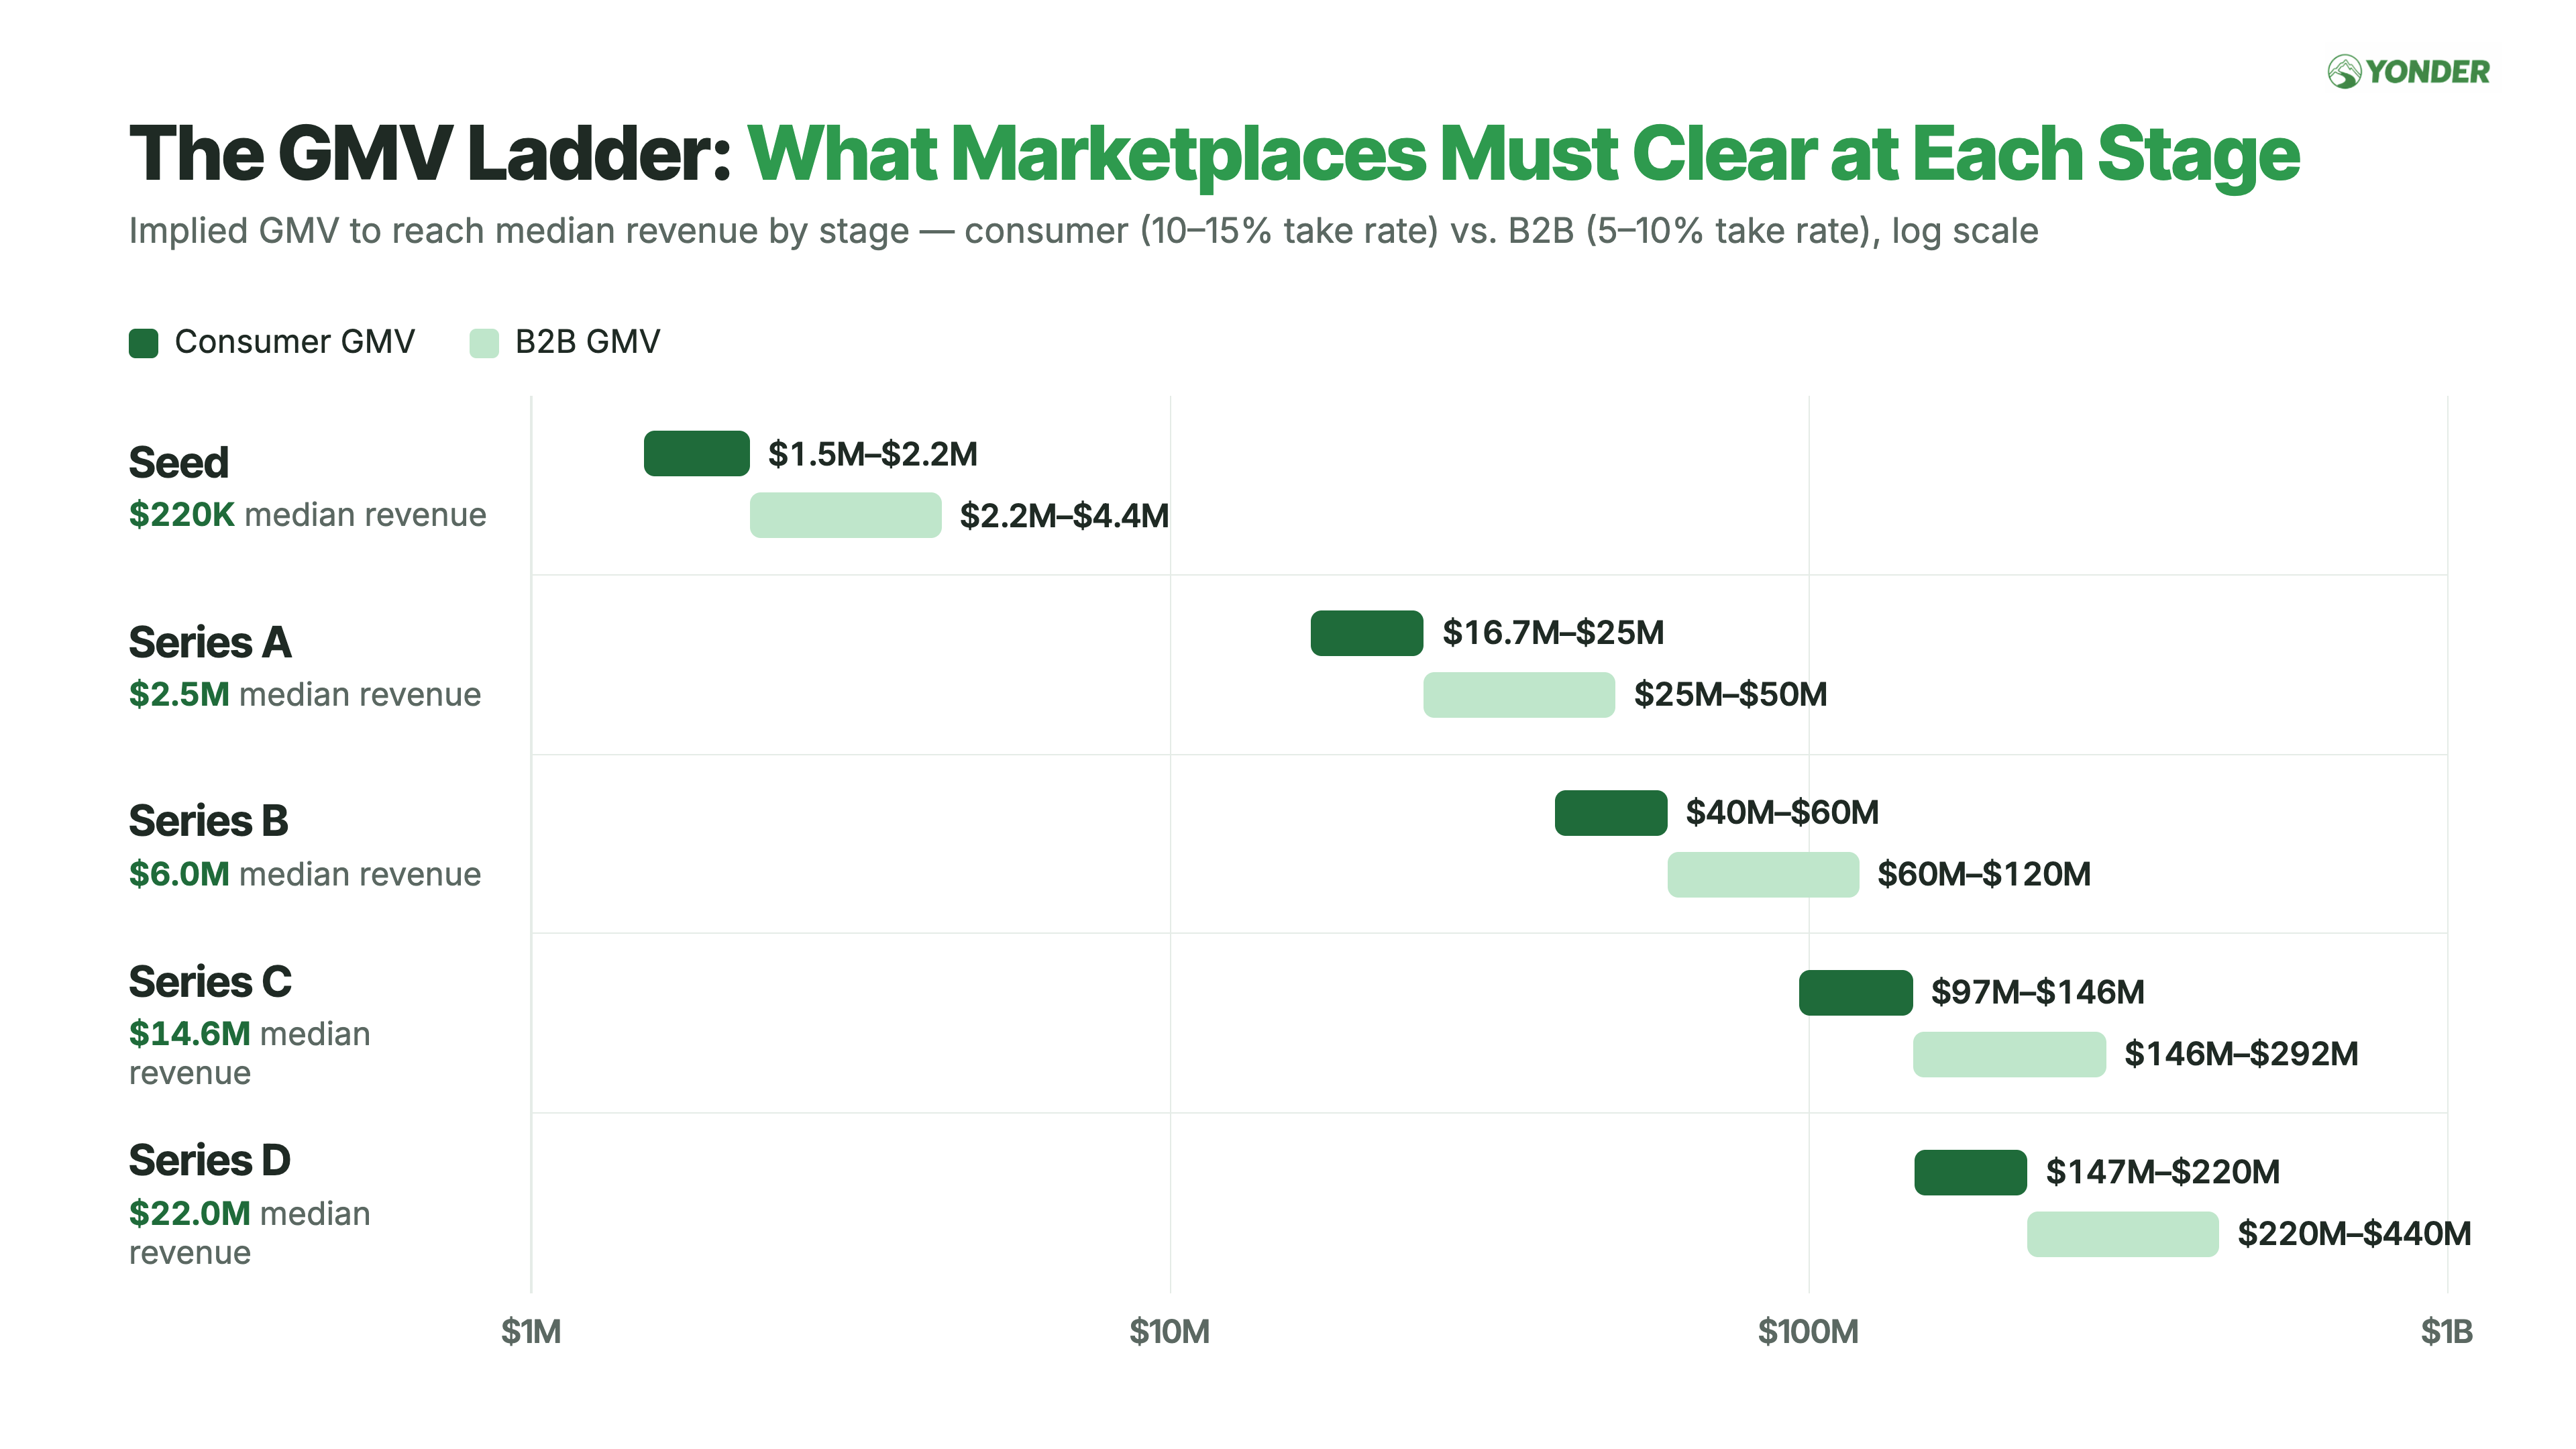
The practical takeaway is that the Seed-to-Series A jump now defines the marketplace fundraising journey. At a constant take rate, founders must grow GMV roughly 11x to move from the median Seed benchmark to the median Series A benchmark.
The Series A No Man’s Land
That jump creates a predictable no-man’s land between Seed and Series A. I see strong marketplace companies with real usage and $1M–$2.5M in revenue all the time. The business is working, but not yet at the level required for the next institutional step-up.
A marketplace doing $15M in GMV at a 10% take rate generates $1.5M in revenue, well below the $2.5M median Series A benchmark. Reaching that median requires roughly $25M of GMV at a 10% take rate or $16.7M at a 15% take rate, unless software, payments, advertising, financing, or other revenue streams close the gap.
The graduation data points in the same direction. Only about 3% of Seed companies reach Series A within 12 months, and roughly 10%–20% do so within 36 months, depending on the vintage. About 18% of companies that raised a Series A in 2025 had previously raised a Seed extension.
Seed extensions have become common enough that you could argue the Seed extension is the new Series A. It is increasingly the round that funds the move from early liquidity to the revenue, repeat behavior, and unit economics now required for a true institutional Series A. Founders should think about an extension as part of the base case, not as a sign that something has gone wrong.
That changes how I am advising the Yonder portfolio. I increasingly think of the Seed journey as two rounds: the initial Seed funds the wedge and proves the marketplace works; the extension funds the climb toward an obvious Series A. That means raising enough at Seed, keeping burn lower, and reaching profitability or breakeven earlier than I would have advised in a hotter market. Profitability is not always the end goal, but it gives founders control over timing and keeps the extension from becoming existential.
The companies that navigate this well treat the extension as a deliberate bridge: tighten burn, add higher-margin revenue, keep compounding GMV, and return to market when the Series A is obvious. The mistake is spending six to nine months trying to force a round before the market supports it.
What Valuation Should I Raise At? (Pre-Seed Edition)
This has been one of the most popular sections, and the one founders tell me is most helpful. It is also the part of the market I know best.
The point is not to say, “This is what you can get in the market.” These ranges are a starting point for thinking about the valuations most likely to clear the market at a given level of progress. Team, market, traction, competition, and investor demand can move a company well above or below them.
Yonder’s dataset is based on a sample of 2,243 fundraising asks. This is what Founders have self-specified and not what the deals got done at per se. Looking at valuation by annual revenue run rate (not ARR) gives founders a more useful benchmark.
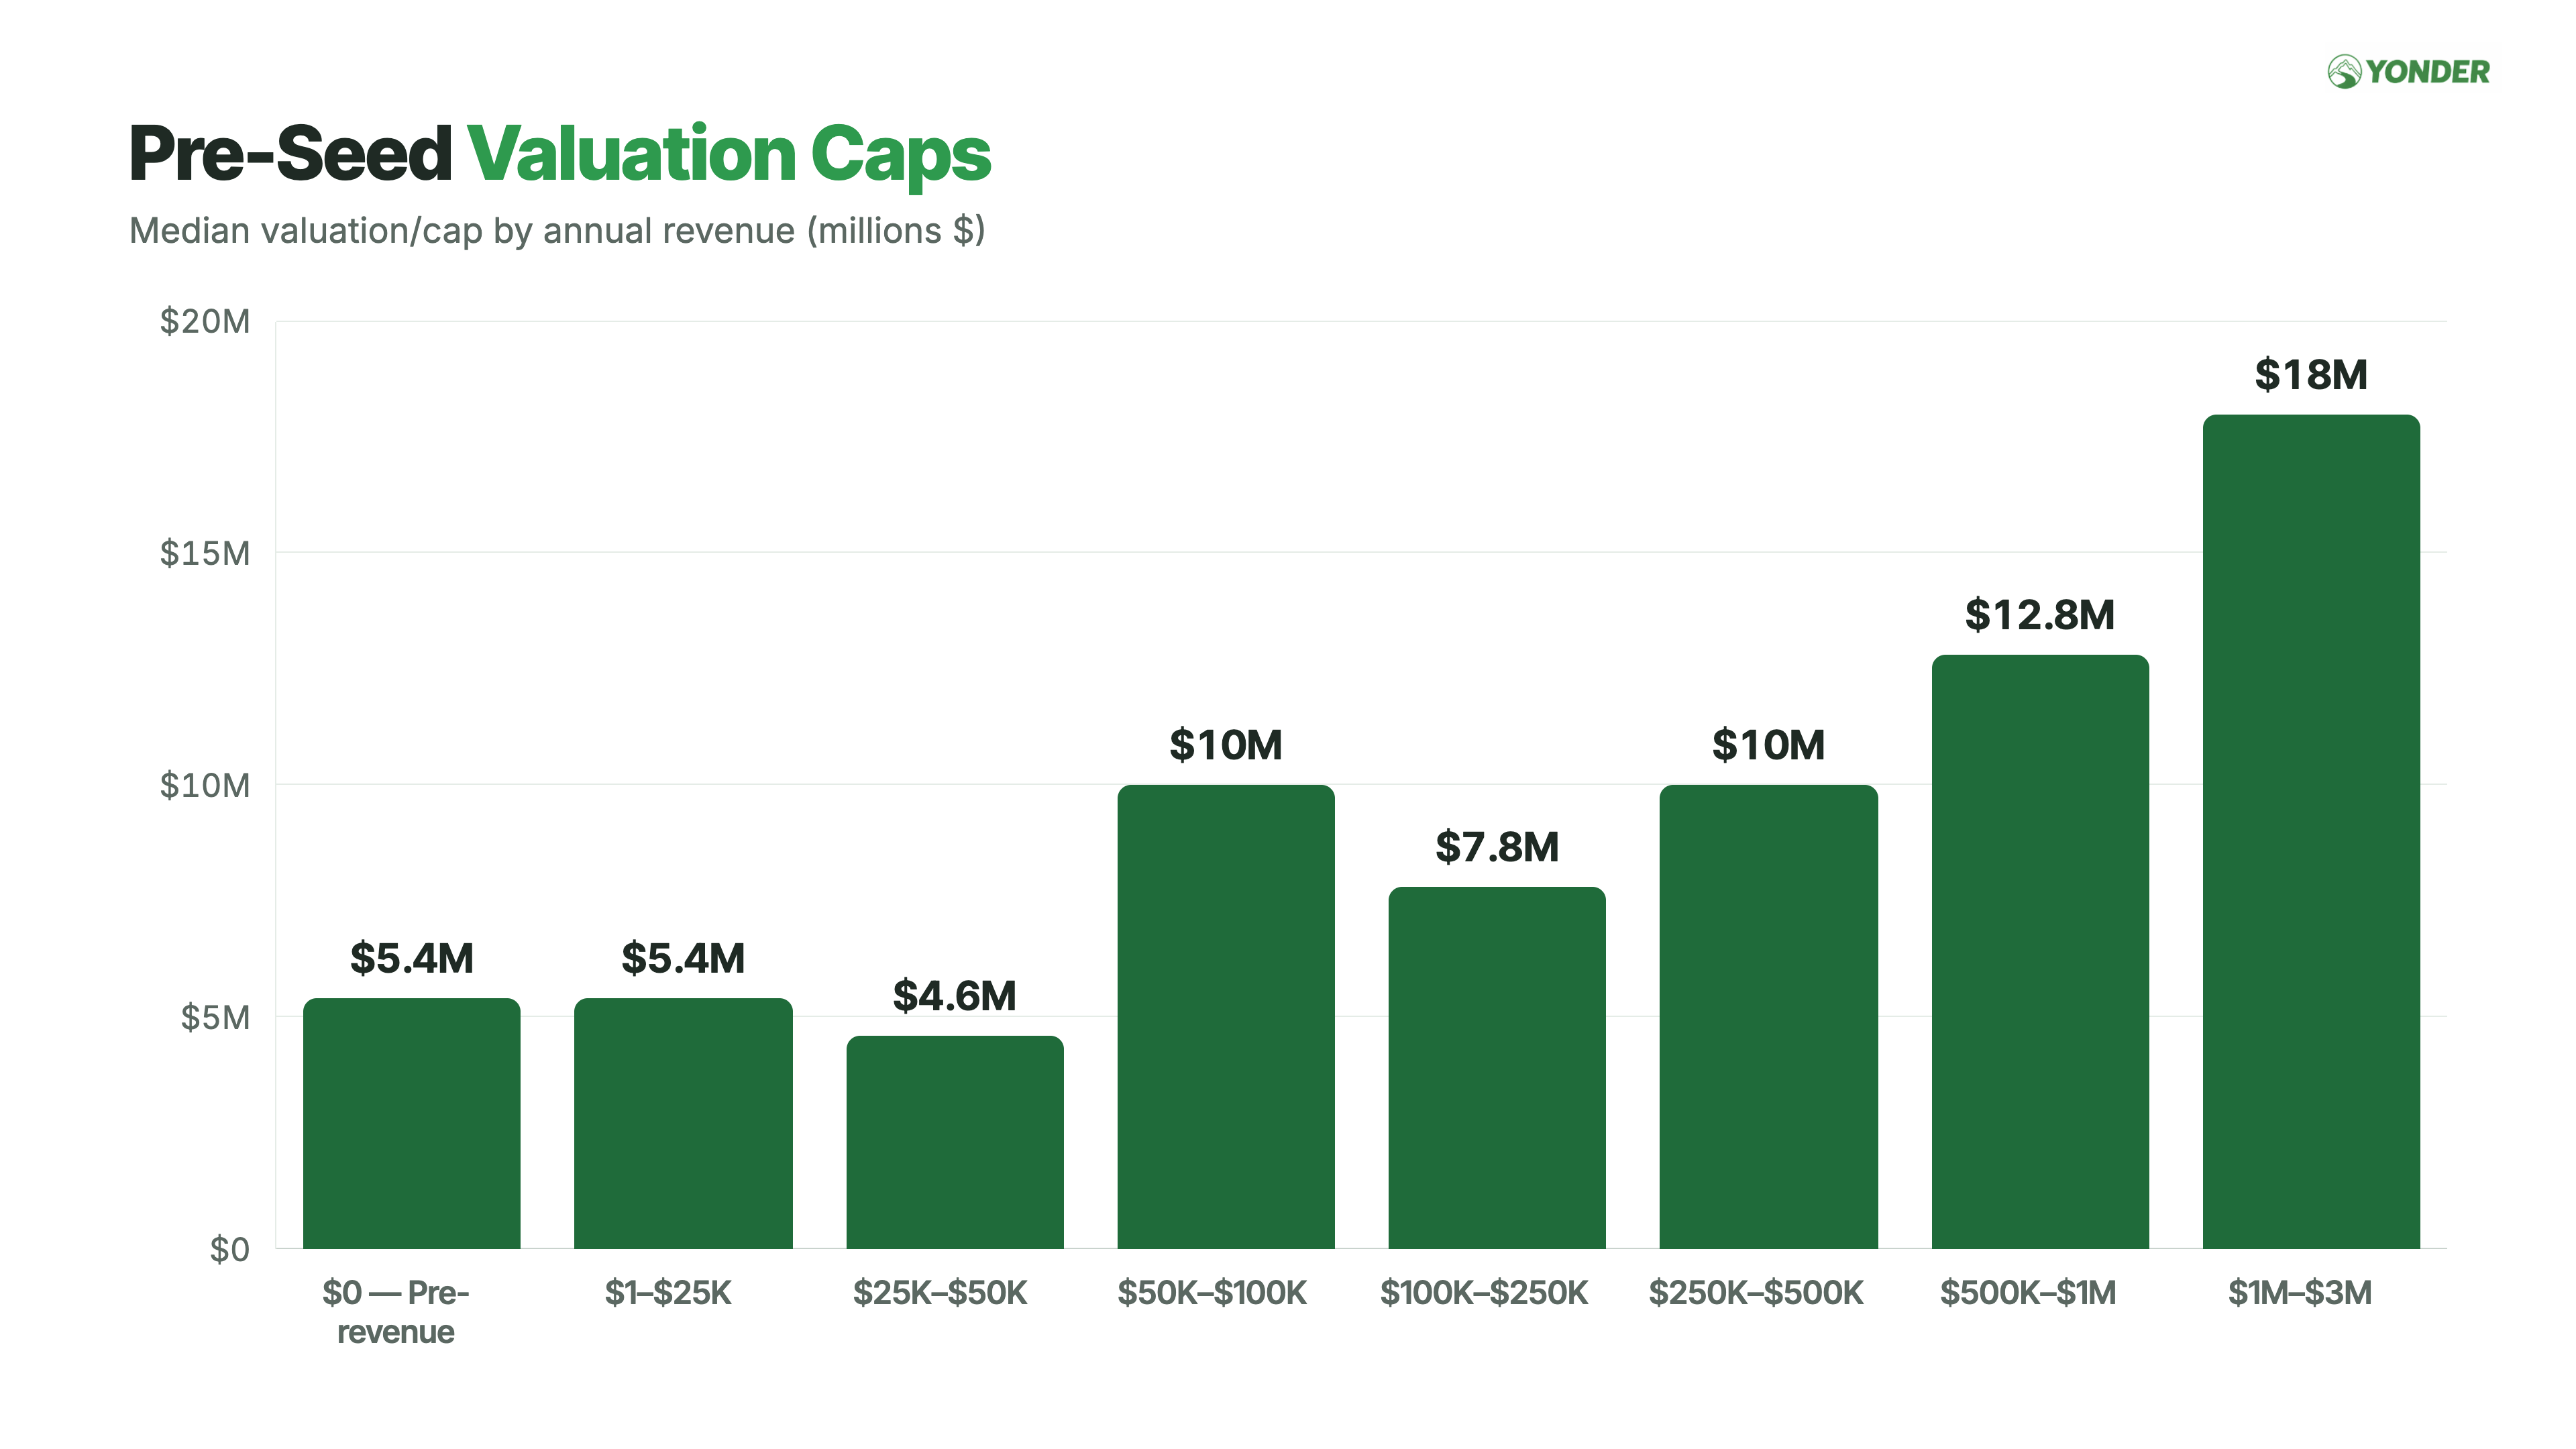
Marketplace revenue helps, but the relationship isn’t exactly linear. Companies with annual revenue below $50K cluster around a $5M valuation. The first meaningful step-up occurs between $50K and $100K, where the median reaches $10M. Above $500K, pricing begins to separate more clearly: $12.8M at $500K–$1M and $18M at $1M–$3M. The practical takeaway is not that each revenue milestone mechanically produces a valuation. Meaningful revenue expands the range of outcomes, but momentum and investor demand still determine where a company lands.
Combining this dataset, the Carta data, and what I am seeing in the market, these are the ranges I would use as a starting point for marketplace companies to go to market with for fundraising:
Pre-product or post-product with little to no revenue (up to $50K): $5–8M
Post-product with early revenue ($50K–$500K): $8–12M
Post-product with meaningful revenue ($500K–$1M): $12–15M
Post-product with a year-ish+ of revenue ($1M–$3M): $15–20M+
Consensus or AI deals: Your guess is as good as mine, but really high valuations
The biggest change is not the median. It is the spread. Revenue starts to matter once it is meaningfully above zero, but annual revenue run rate alone does not determine the price. Growth, liquidity, repeat behavior, team, and investor demand still drive where a company lands within or above these ranges.
Conclusion: Marketplace Winter Is a Selection Story
The data leaves me with five takeaways.
First, marketplace winter is primarily a story of selection. Far fewer companies are getting funded, but Pre-Seed and Seed valuations have held up for the companies that do. Series B shows the same effect even more clearly: volume and round sizes are down sharply, while valuations still reward the survivors.
Second, Series A is the choke point. It is the only stage where round count, capital, round size, and valuations have all been meaningfully repriced. The median company needs to grow revenue roughly 11x between Seed and Series A. That helps explain why Seed extensions are becoming a normal bridge rather than a sign of distress.
Third, marketplaces may be less capital-intensive than conventional wisdom suggests: dilution was 10.6% at Seed and 15.0% at Series A, both below SaaS and Fintech. That may reflect stronger monetization, or simply smaller rounds in a less-favored category. Either way, low dilution only helps if it buys enough runway.
Fourth, revenue matters, but it does not mechanically determine valuation. The Yonder data shows clear valuation step-ups as annual revenue grows, but also a wide spread between companies at similar revenue levels. Growth, liquidity, repeat behavior, team, market, and investor demand still determine where a company lands.
Fifth, AI changes what the best marketplaces can become. It can lower operating costs, improve matching, automate workflows, and open new categories. But it also makes thin matching easier to copy. The durable value remains in hard supply, proprietary data, deep workflow, repeat transactions, and the people participating in the network.
The market is back to caring about the things it probably should have cared about all along: revenue quality, liquidity, repeat behavior, capital efficiency, and real network effects. The bar is no longer simply proving that people will transact. Founders need to show that early liquidity can compound into better economics and a more defensible network.
What founders should do with this
Raise from proof points. Work backward from the revenue, GMV, liquidity, and runway required for the next round. Optimizing only for dilution can leave a company underfunded.
Plan for the Seed-to-Series A gap. Budget more time than the traditional venture timeline assumes, and treat an extension as a deliberate option rather than a failure.
Prove the quality of liquidity. GMV matters, but repeat behavior, supply density, retention, contribution margin, and organic matching are what make the next round obvious.
Build revenue beyond the take rate. SaaS, payments, financing, advertising, data, and workflow products give founders more ways to monetize the same network.
Use AI to improve both efficiency and defensibility. Automate operational work by using proprietary supply, data, and workflows to make the marketplace harder to copy.
Do not get hung up on the marketplace label. The strongest companies may look like vertical software, Fintech, data infrastructure, or managed services built around a transaction network. That is usually a feature, not a bug.
There is an investor takeaway, too. When generalist capital backs away from a category, specialists get better access and often better prices. The opportunity is not to fund every company calling itself AI-native; it is to understand which networks have real liquidity, durable supply, strong monetization, and a credible path from zero to escape velocity.
That is a big part of why I started Yonder. Marketplace winter is real, but the category is not dead and is badly overlooked. The best companies are still being built, and the strongest ones are still getting funded. If you are building one of these businesses, especially in a Marketplace+ or AI-native category, I want to hear from you at colin@yonder.vc. If you invest in the category, I would love to hear from you as well.
About Me:
Colin is a marketplace geek and the General Partner of Yonder, a pre-seed marketplace fund that invests in marketplaces that create new economies. He has also been a longtime advisor to marketplaces, helping them with product growth, monetization, liquidity optimization, and strategy. Previously, he served as the CPO/CRO at Outdoorsy and has worked at Tripping.com, Ancestry.com, JustAnswer, and the Federal Reserve.
Still early in that timeline but understanding this will shape my thinking/ expectations. Thank you
Awesome report! Thank you